Troubleshooting source control
This article helps you diagnose and resolve Git issues in Visual Studio Code using output logs and trace logging. Use these diagnostic tools when Git operations fail or behave unexpectedly.
Git Output window
VS Code uses your machine's Git installation to perform source control operations. The Git Output window provides detailed logs of Git commands executed by VS Code. This information is useful for understanding what Git operations are being performed and for diagnosing issues.
To open the Git Output window:
-
In the Source Control view, select the ... menu and select Show Git Output
-
Run the Git: Show Git Output command from the Command Palette (⇧⌘P (Windows, Linux Ctrl+Shift+P))
-
Open the Output panel (⇧⌘U (Windows Ctrl+Shift+U, Linux Ctrl+K Ctrl+H)) and select Git from the dropdown menu
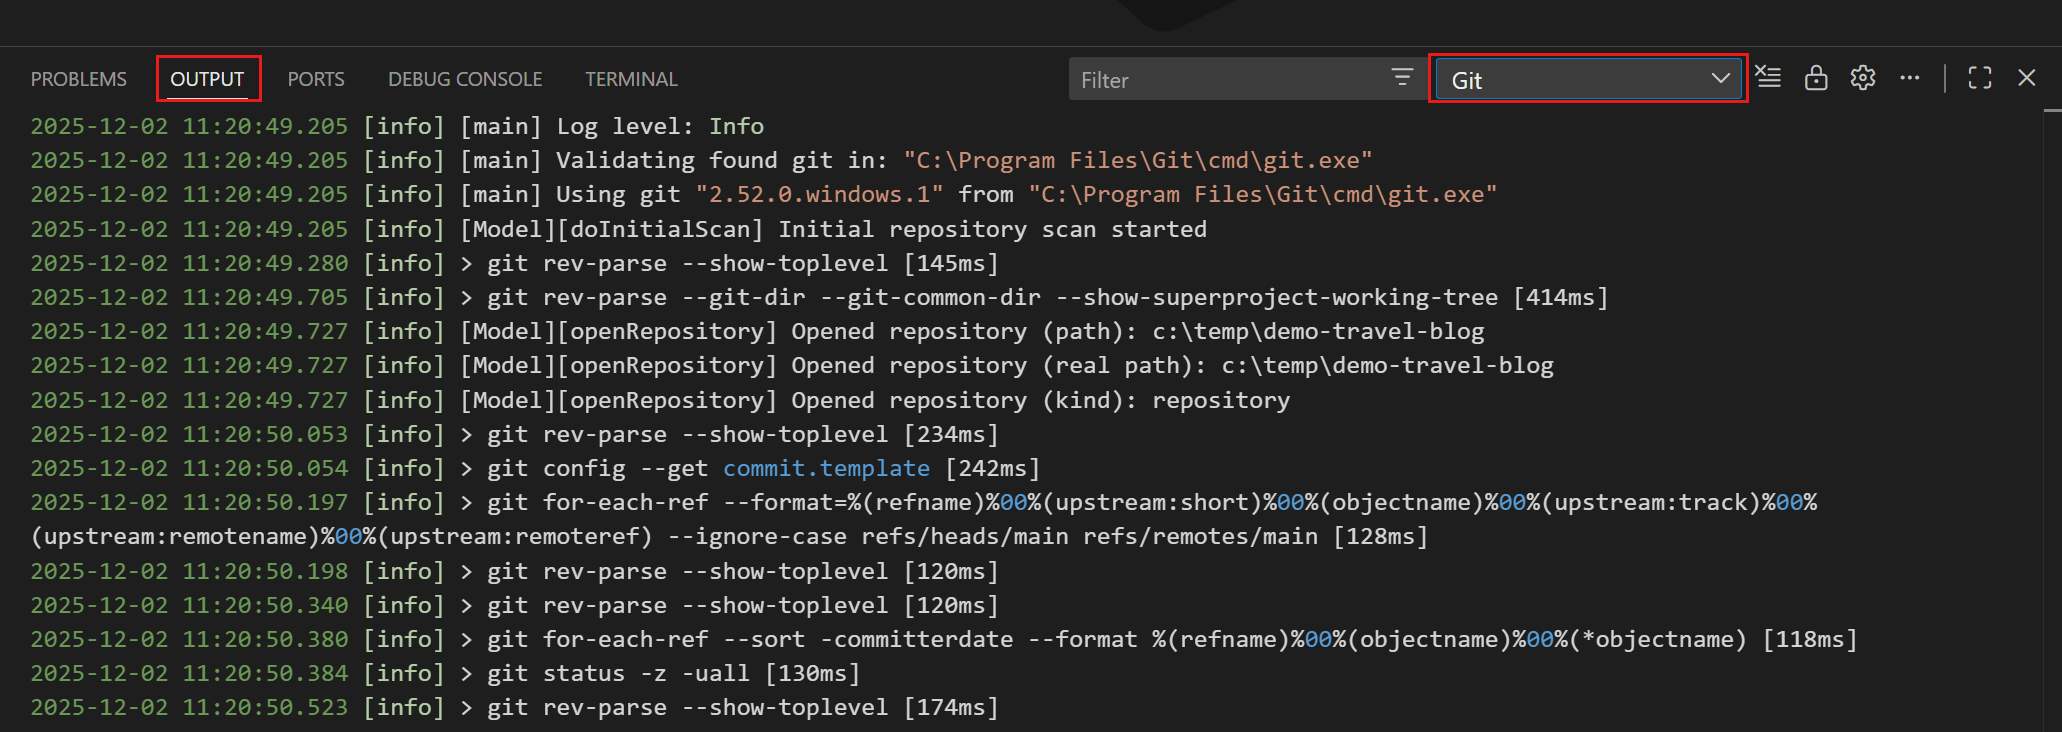
The Git Output window displays:
- Current log level of the Git extension
- Location of the Git executable being used
- Git commands executed by VS Code
- Command error messages
- Timestamps and duration of each command
Review this output when Git operations fail or behave unexpectedly. The information helps identify issues with Git configuration, authentication, or repository state.
By default, the Git Output window doesn't show stdout from Git commands unless an error occurs. With the git.commandsToLog setting, you can specify which Git commands should always log their stdout output for more detailed diagnostics.
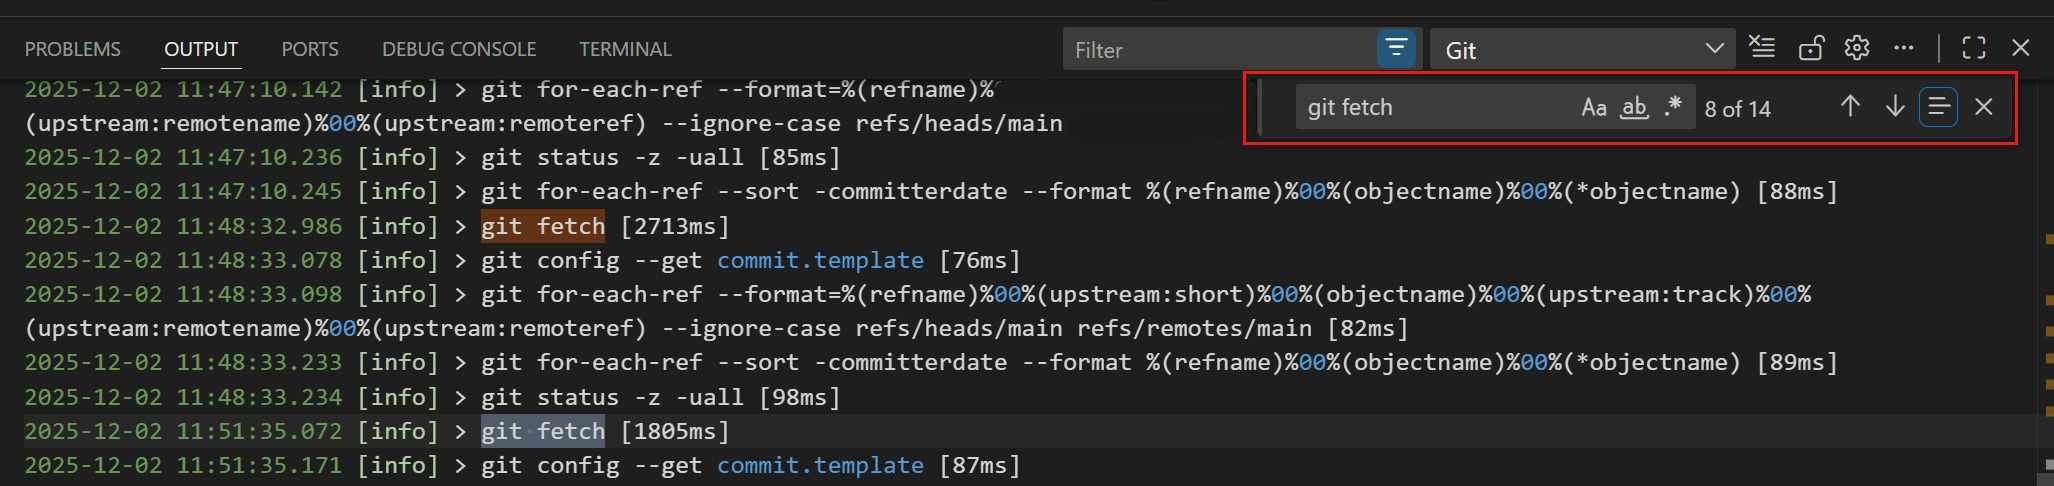
Filter and search Git logs
The Git Output window can generate a large amount of information. To find relevant entries efficiently, you can use the following techniques:
-
Filter the output by log level or log category using the dropdown menu in the Output panel
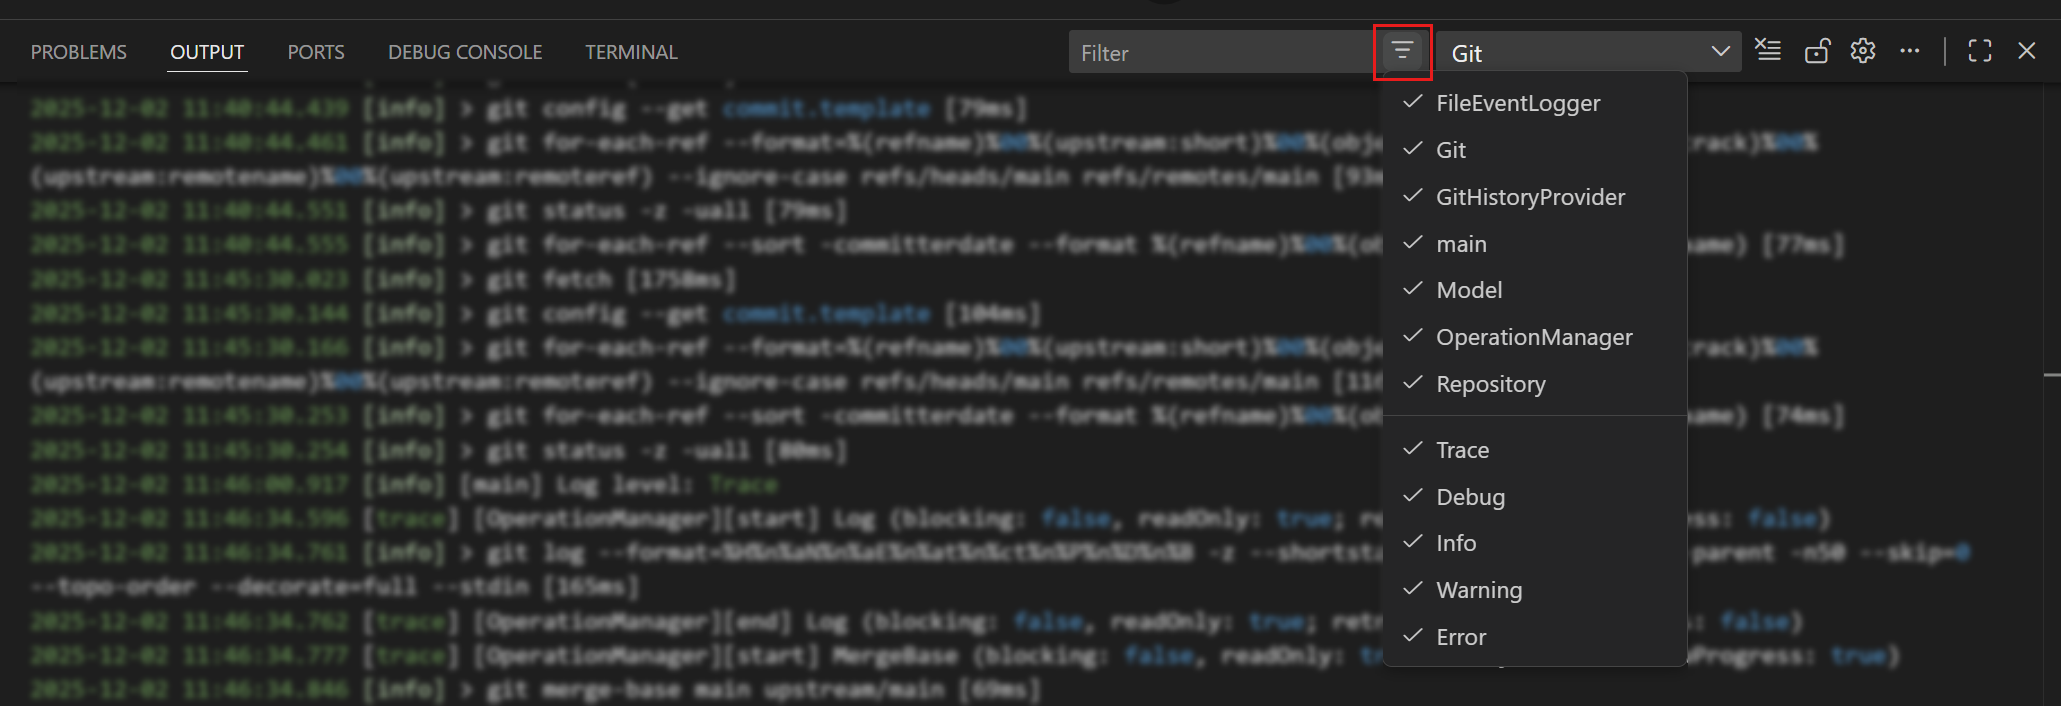
The log levels include:
trace,debug,info,warning,error. By default, the Git Output window showsinfolevel and above.The log categories change based on the content being logged, such as
gitorrepository. To view the Git commands being run, select thegitcategory. -
Search for specific terms using the search box in the Output panel (⌘F (Windows, Linux Ctrl+F))
The Git Output window highlights the search terms and allows you to navigate between matches. The search box supports regular expressions for advanced searching.
Enable trace logging for the Git extension
For more detailed diagnostic information, you can enable trace logging for the Git extension. Trace logging provides verbose information about the extension's operation, including internal state and detailed command execution.
To enable trace logging:
-
Open the Git Output window
-
Select the gear icon in the Output panel header and select a log level, such as
trace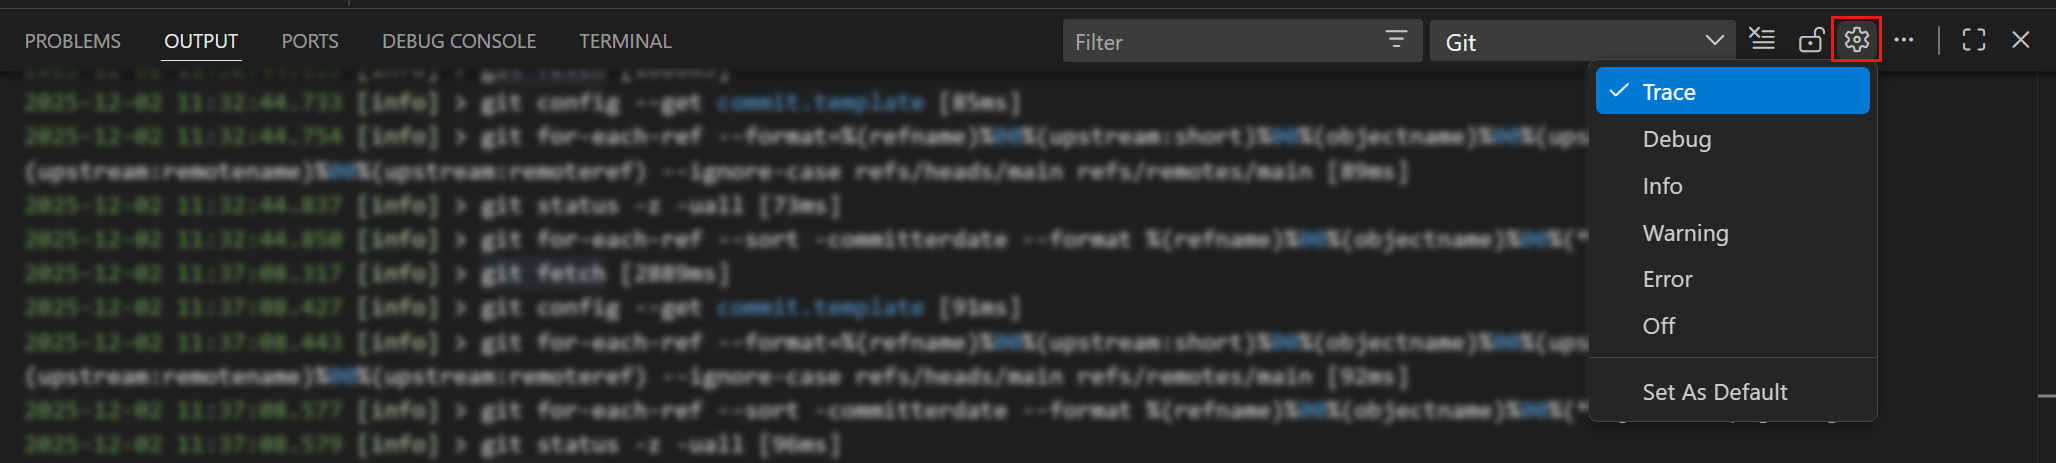
When you choose a log level, VS Code logs messages at that level and above. For example, selecting
tracelogs all messages, while selectingerroronly logs error messages.
Next steps
- Source Control FAQ - Answers to frequently asked questions about Git and source control
- Source Control Overview - Learn about VS Code's source control features
- Git Documentation - Official Git documentation and resources