C# Dev Kit FAQ
Use this FAQ (Frequently Asked Questions) topic to learn more about the C# Dev Kit extension and troubleshoot issues you may be experiencing.
General
What is C# Dev Kit?
C# Dev Kit is an extension created to enhance your C# development experience in Visual Studio Code. It aims to bring a more expansive, productive, and reliable C# experience to VS Code. C# Dev Kit does not replace the existing C# extension but adds on top of the great language service features it provides. Developers can choose to continue using the updated version of the existing C# extension or enhance their experience by adding C# Dev Kit.
What project types are currently supported?
C# Dev Kit supports building web apps, console apps, class library projects, and test projects for .NET Core, often also called .NET. The .NET MAUI extension and the Unity extension are built on top of C# Dev Kit and provide additional support for building .NET Multi-platform App UI (MAUI) apps and Unity apps. These extensions support the modern .NET project format, also known as "sdk-style" projects. If you are building non-SDK-format projects such as .NET Framework apps and Xamarin apps, see the Project System section.
What extensions are included in C# Dev Kit?
Today the extensions included in the C# Dev Kit family are:
Use of these extensions are governed under the EULA for the C# Dev Kit family of extensions.
These extensions also have dependencies that carry their own licensing – for example, C# Dev Kit depends on the C# extension and .NET Install Tool.
Why isn't C# Dev Kit activating / C# Dev Kit commands are not found?
There are a few reasons why C# Dev Kit doesn't activate when you attempt to edit a C# file.
- version 2.0+ of the C# extension is not installed. C# Dev Kit requires version 2.0 or higher of the C# extension. Check to make sure you have the C# extension installed and that you have a version 2.0 or higher.
- workspace prefers C# extension. C# Dev Kit does not support .NET Framework projects and if you have set the
dotnet.preferCSharpExtensionsetting to true, C# Dev Kit will be disabled for that workspace. If the project is not a .NET Framework project, make sure to disable this setting. - using a readonly OS. C# Dev Kit requires write access to its own extension folder and to the VS Code-provided folder for extensions to write arbitrary state within the operating system, so if you are using an OS that is completely readonly, C# Dev Kit will not work.
If you have checked these and the C# Dev Kit commands are still not found, please report an issue and provide the information in the Output window for C# Dev Kit.
Licensing and Contributing
Who can use C# Dev Kit?
C# Dev Kit is available via a Community License for those who qualify and is also included as another addition to existing Visual Studio Subscriptions. This means that C# Dev Kit is available to use today for developers with active Visual Studio subscriptions.
For personal, academic, and open-source projects, C# Dev Kit can be used at no cost. For commercial purposes, teams of up to 5 can also use the C# Dev Kit at no cost. For 6+ developers, those users will need a Visual Studio Professional (or higher) subscription. C# Dev Kit is also included in GitHub Codespaces and Microsoft Dev Box, so users of those products have access to C# Dev Kit at no additional charge.
Where do I submit feedback and suggestions?
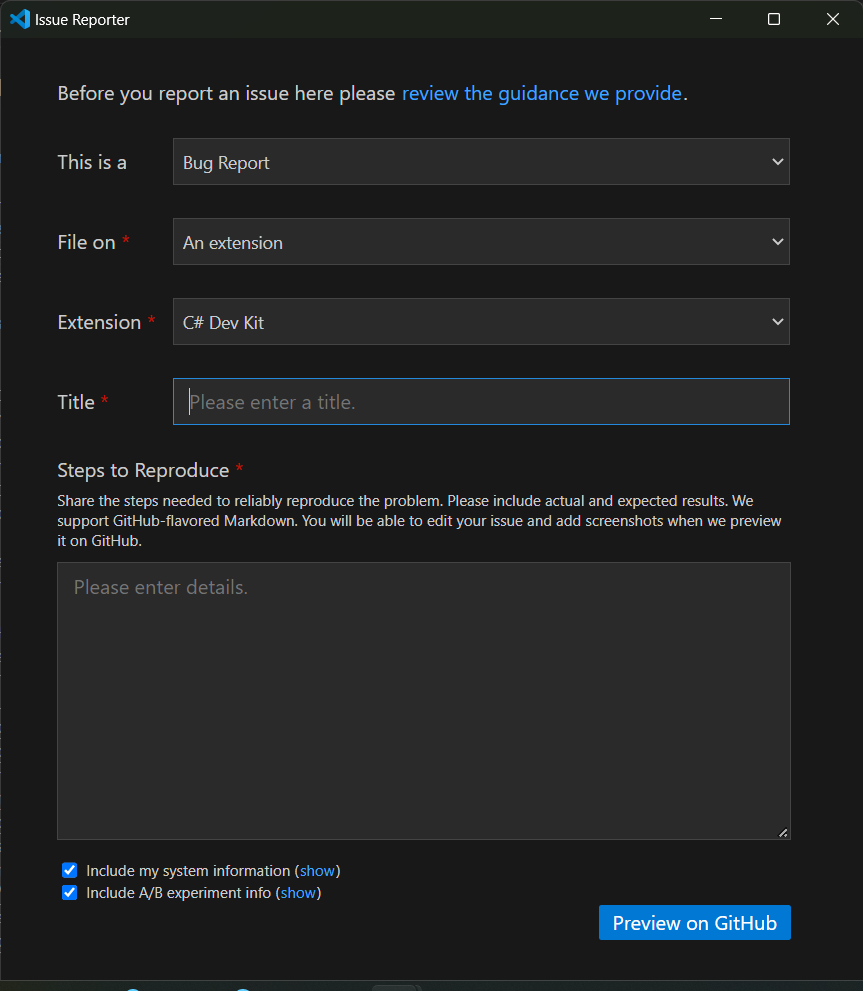
Users can report an issue or a suggestion through VS Code's Help > Report Issue. Select whether it is a bug, feature request, or performance issue, file on An extension, and select C# Dev Kit from the list of extensions.
Is C# Dev Kit open source? Why not?
No. C# Dev Kit is closed source but depends upon the C# for VS Code extension, which is open source, and both communicate with open-source components such as Roslyn and Razor. One of our goals with C# Dev Kit is to provide an improved productivity experience for C# developers who use VS Code. To achieve this, C# Dev Kit includes some proprietary, closed-source features that are shared with our other tools. To make these experiences available to VS Code users, we needed to introduce C# Dev Kit as a closed source extension.
How can I contribute?
The C# extension, which is a part of the C# Dev Kit, is fully open source and is subject to these license terms. The source code to this extension is available on https://github.com/dotnet/vscode-csharp and licensed under the MIT license.
This project has adopted the code of conduct defined by the Contributor Covenant to clarify expected behavior in our community. For more information, see the .NET Foundation Code of Conduct. By signing the CLA, the community is free to use your contribution to .NET Foundation projects.
.NET SDK
Install script timed out
Note that, depending on your network speed, installing the .NET Core runtime might take some time. By default, the installation terminates unsuccessfully if it takes longer than 4.5 minutes to finish. If you believe this is too little (or too much) time to allow for the download, you can change the timeout value by setting dotnetAcquisitionExtension.installTimeoutValue to a custom value.
Learn more about configuring VS Code settings and see below for an example of a custom timeout in a settings.json file. In this example, the custom timeout value is 180 seconds, or 3 minutes:
{
  "dotnetAcquisitionExtension.installTimeoutValue": 180
}
Error acquiring .NET SDK
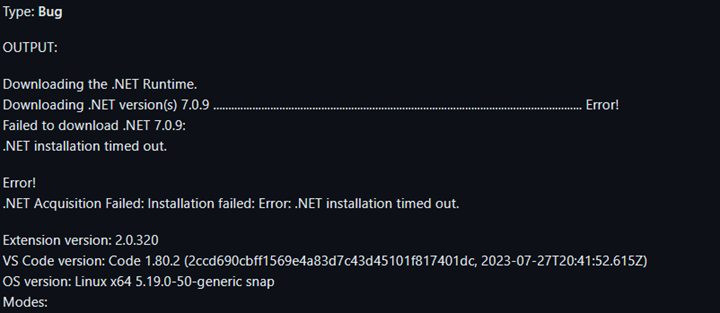
Note: If you are located in China, your .NET SDK download may be blocked and cause a timeout.
You will need to make sure you have .NET SDK installed. As a workaround, you can point the .NET runtime acquisition extension to an existing .NET install:
How do I manually install .NET?
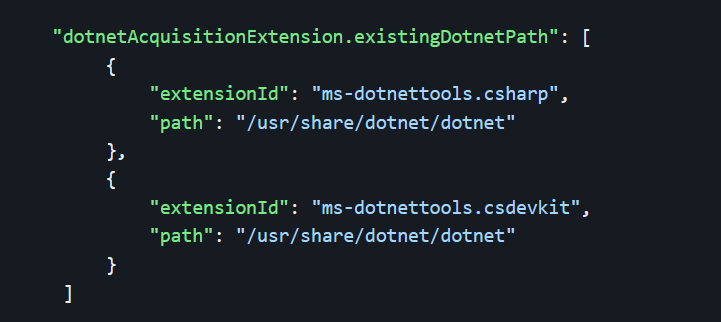
If .NET installation is failing or you want to reuse an existing installation of .NET, you can use the dotnetAcquisitionExtension.existingDotnetPath setting. .NET can be manually installed from the C# Dev Kit Walkthrough or the .NET website. To direct the extension to that installation, update your settings with the extension ID and the path as illustrated below:
Windows
{
  "dotnetAcquisitionExtension.existingDotnetPath": [
    {
      "extensionId": "msazuretools.azurerm-vscode-tools",
      "path": "C:\\Program Files\\dotnet\\dotnet.exe"
    }
  ]
}
macOS
{
  "dotnetAcquisitionExtension.existingDotnetPath": [
    {
      "extensionId": "msazuretools.azurerm-vscode-tools",
      "path": "/usr/local/share/dotnet/dotnet"
    }
  ]
}
The extension thinks I am offline with error response of 400 or 407, and I have a proxy
If your system uses a proxy and has registry access disabled, you need to explicitly set the proxy URL in the extension settings. Proxies are automatically detected when set via environment variables and the registry, but if your proxy is only managed via registry keys and registry access is disabled, the extension cannot find it. To set the proxy URL, add the extension setting below:
{
  "dotnetAcquisitionExtension.proxyUrl": "https://your_proxy_url:port"
}
Project System
The Solution Explorer reports that my project is not supported in C# Dev Kit
This is usually because the project targets .NET Framework rather than .NET Core/.NET. At this time, C# Dev Kit does not support .NET Framework projects.

To resolve this issue, you have two options.
You can update your project to an SDK-style project to access all available C# Dev Kit features.
Alternatively, you can delegate project and solution load to the C# extension, using the Prefer CSharp Extension workspace setting in the Settings editor. Keep in mind that some C# Dev Kit features will not be available with this setting. To access this setting, go to the Settings editor and select the Workspace tab. Then, search for "Prefer CSharp" in the search bar and check the box next to the Prefer CSharp Extension setting. If you're trying to load a .NET Framework project, C# Dev Kit will automatically display a notification asking you to either update your project to an SDK-style project or have the C# extension load your project or solution by selecting Use C# Extension from the notification. This option will automatically select the Prefer CSharp Extension setting. Note that you'll need to reload VS Code for this setting to take effect.
I clicked on the "Create .NET Project" button and nothing happened
This usually occurs when there is an extension version mismatch. C# Dev Kit requires version 2.0 or greater of the C# extension. If you are on v1 of the C# extension, C# Dev Kit, and the C# Dev Kit related commands will not work properly. To fix this, upgrade the C# extension to the latest version.
The Project System reports that it ran into a problem
When an internal Project System error occurs, you'll generally see a notification like this pop up in a corner of VS Code:

Select the Open log button to open a view showing a stack trace of where the problem occurred. Select and copy all the text in the log. Report the issue through VS Code and make sure to include the copied text from the log.
When I open my solution, I get the notification "Failed to restore solution"
Select Show error. This opens the Output panel for NuGet. Read through the error to determine why the package restore was unable to complete. If you are unable to resolve the problem, report the issue through VS Code.
The Solution Explorer displays "A compatible .NET SDK was not found"
The most likely cause of this error is a global.json file that specifies a different SDK than what is installed on the system.

Open the Output window and switch to the Projects pane to look for more information. You should see something like this:

To fix the issue, either update the global.json to specify an installed SDK or install the specified SDK from the Download .NET page.
Next, close and reopen the workspace.
It is also possible that the SDK is not installed in a location known to C# Dev Kit. This can happen, for example, if the SDK was installed by a package manager rather than through the Microsoft-provided installers. To fix this, uninstall the SDK via the package manager, and then install it via Download .NET.
Test Explorer
Why don't my tests appear in the Test Explorer panel?
Make sure your solution includes a test project. Only test projects that are part of the opened solution will be included. To see if the test project is part of the solution, open the Solution Explorer view in the File Explorer and see if the project appears in the tree. Right-click on the solution node to add existing test projects, or to create a new test project in the solution.
C# Dev Kit also requires that it has built your project successfully before tests appear in the Test Explorer panel. Also, if a Clean is done on your project/solution, the test dlls are removed from the Test Explorer panel.
Once you have validated that your test project is part of the solution, build your solution by right-clicking on the solution in the Solution Explorer and select Build or use ⇧⌘B (Windows, Linux Ctrl+Shift+B). Once the build has been completed, your tests will appear in the Test Explorer panel.
If your tests are still not appearing, consider the following additional checks:
- Supported .NET Core SDK: Ensure you are using a supported .NET Core SDK for your platform and machine. Some SDKs do not work on specific operating systems or architectures. For more information, check the official .NET download page: https://dotnet.microsoft.com/en-us/download.
- Valid SDK installation: Verify that a valid SDK installation is detected. You can enable diagnostic logging to check which SDK is detected for your .NET project. Note that .NET SDKs installed via unsupported tools like ASDF or Mise may not be detected, as they deviate from Microsoft’s official installation methods. We recommend following the official instructions.
- Build output: Confirm that the build is complete and has generated the corresponding output binaries, such as
.dllor.exefiles. - Project loading: Ensure all projects have finished loading. In the Solution Explorer, look for a test icon next to test projects to confirm they are detected.
My tests appear in the Test Explorer panel, but I cannot debug them
Make sure that your tests are targeting NET Core. C# Dev Kit does not support .NET Framework projects, although .NET Framework projects may load and appear to work. The debugger in VS Code does not support .NET Framework.
I just added new tests to my test project, and they are not appearing in the Test Explorer panel?
C# Dev Kit requires that it has built your project successfully before tests will appear in the Test Explorer panel.
Build your solution by right-clicking on the solution in the Solution Explorer and select Build or ⇧⌘B (Windows, Linux Ctrl+Shift+B). Once the build has been completed, your tests will appear in the Test Explorer panel.
How do I collect logs for troubleshooting issues with Test Explorer?
If you are encountering issues with Test Explorer, you can enable diagnostic logging to gather more information for troubleshooting:
- Increase Test Explorer verbosity:
Navigate to the C# Dev Kit settings and increase the Test Explorer Verbosity setting from
minimaltodiagnostic. This will generate more detailed logs. - Check the Output Window:
Open the Output window in Visual Studio Code, and select C# Dev Kit - Test Explorer from the dropdown. Diagnostic messages will appear with a
[dev]prefix. - Collect the following information:
When reporting an issue, ensure you include:
- The diagnostic logs from the Output window.
- Your operating system and version (for example, Windows 10, macOS 13).
- The version of the C# Dev Kit extension you are using. Go to the Extensions view, and hover over the extension to view the version information.
This information will help in diagnosing and resolving the issue more efficiently.
Debugger
When I F5, nothing happens
Make sure you have a C# project open or that the active document is a .cs or .razor file. If the debugger still fails to load, make sure that both the C# Dev Kit and the C# extensions have been activated.
When I F5, it asks me to "Select a Debugger". How do I know which one to pick?
If you're trying to debug .NET Console Applications, Blazor Server Apps, Blazor WebAssembly, or Web Applications, make sure to select the C# option. The other options may be part of other extensions such as Node for JavaScript debugging or Python for Python debugging, and are not part of C# Dev Kit.
When I F5, it prompts me to input a password (macOS only)
macOS has Developer Mode disabled by default and prompts a password to protect the user if a program wants to be used as a debugger.
If you wish to disable these prompts, you can run the following commands:
DevToolsSecurity --enablesudo dscl . append /Groups/_developer GroupMembership $USER
Why is debugging not working?
If you're trying to debug a library or a test project, it's likely that you'll need to take some extra steps to ensure that your code is properly debugged. To debug a library, you can create a console or web application that interacts with the library. For a test project, you can use the Test Explorer to debug your code effectively.
While debugging, my breakpoints aren't binding
The process you're debugging is not built in Debug, make sure to build as debugging before debugging the process.
C# Editor
How do I get IntelliSense to work correctly?
Make sure that you have a project or solution open. If you have multiple solutions, the extension will automatically open one or prompt you to open one. Next, search for "Trace" in the Settings search bar, and set the Dotnet > Server: to Trace from the drop-down. This option provides more output information to help the developer team diagnose the issue.

Once you've made this change, reload the window by opening the Command Palette (⇧⌘P (Windows, Linux Ctrl+Shift+P)), then typing "Reload Window" and pressing Enter. After reloading the window, check the project log in the Output panel (⇧⌘U (Windows Ctrl+Shift+U, Linux Ctrl+K Ctrl+H)) and selecting Projects from the drop-down. This will show any errors related to your project not being fully loaded. Copy all the text in the Output panel and report the issue through VS Code, making sure to include the copied text.
C# extension fails to launch the server
As a workaround, you can point the .NET runtime acquisition extension to an existing .NET 7 install with the dotnetAcquisitionExtension.existingDotnetPath setting:
{
  "dotnetAcquisitionExtension.existingDotnetPath": [
    {
      "extensionId": "msazuretools.azurerm-vscode-tools",
      "path": "C\\Program Files\\dotnet\\dotnet.exe"
    }
  ]
}
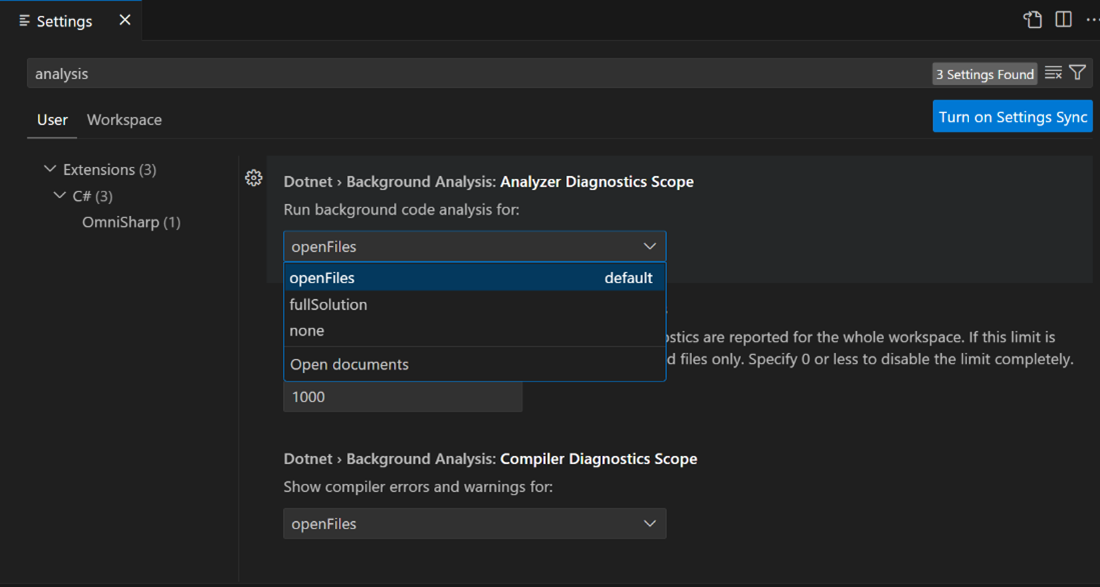
I have too many diagnostics or I don't have enough diagnostics
The C# extension allows you to configure various background code analysis settings. To access the settings, go to File > Preferences > Settings or use the keyboard shortcut (⌘, (Windows, Linux Ctrl+,)). In the search bar, type "analysis" to narrow down the settings related to code analysis. Under Run background code analysis for:, you can choose the analysis scope from a drop-down menu. The default setting is to analyze open files, but you can customize it to full solution, none, or open documents.
You can also use an EditorConfig file to configure diagnostics and code analysis. To learn more about EditorConfig, check out the documentation.
If you're not seeing enough diagnostics or none at all, it's possible that your project isn't fully loaded. To check if this is the case, refer to the section How do I get IntelliSense to work correctly? It provides instructions on how to verify if your project is fully loaded.
Razor Editor
Most or all Blazor components show up with warnings
Before Blazor components can be discovered, C# Dev Kit needs to load your project successfully. Additionally, the Razor language server requires a project.razor.vscode.bin file to be generated in order to understand the state of your projects. If this file isn't generated, or is generated without any components, the Razor experience may be affected.
To improve performance, the extension sometimes defers generating or loading this file until you open your first .razor or .cshtml file. To ensure that there are no errors in the Solution Explorer for the project you're trying to use, check it carefully.
If your project has loaded correctly, verify that a project.razor.vscode.bin file exists in the obj\Debug\<tfm> folder on your file system. Since it is a binary file, it isn't straight forward to verify the contents of the file directly, but in general most Razor projects should result in a file that is at least 150KB in size. If the file is only a few kilobytes it means that tag helpers and/or components are probably not being discovered correctly.
To force the file to regenerate, close any open .razor or .cshtml files, reload the VS Code window, and once the project has loaded correctly, open any .razor or .cshtml file to trigger the regeneration process.
Target framework errors are mentioned in Razor files
The Razor language server generally does not have a concept of a "solution", but instead loads projects based on the presence of a project.razor.vscode.bin file in the projects obj\Debug\<tfm> folder. Sometimes, old files from target frameworks that are no longer in use can cause confusion, making the Razor server think a project is multi-targeted or that some components are still referenced when they're not.
To resolve this issue, clear out old folders from within the obj folder or clear all of them. Then, reload the VS Code window and open a .razor file. This should ensure that new JSON files are generated, and the old ones are removed.
IntelliCode
I am not getting whole line completions
Whole line completions are disabled when the GitHub Copilot extension is enabled to allow you to take advantage of the more advanced AI completion capabilities. You can verify that Copilot is enabled by checking if the Copilot logo is present in the lower right corner of VS Code.
Hot Reload
Hot Reload icon not appearing after I started debugging
The debugger only starts a Hot Reload session if the option for Hot Reload is enabled in the C# Dev Kit debugger settings. If the option is enabled, it is expected that the Hot Reload icon appears in the status bar while debugging:

You can either click on the Hot Reload icon or can see diagnostic information by opening the C# Hot Reload Output window. If you don't see either of those, the project may not be supported by C# Dev Kit extension, see Hot Reload supported projects.
What types of edits are supported with Hot Reload?
See Supported code changes for a list of the supported C# code changes with Hot Reload.