Performance Profiling JavaScript
Visual Studio Code supports collecting and viewing performance profiles for JavaScript programs. To get started, you'll first need to have the debugger configured for your Node.js program or browser app.
Types of profiles
Depending on what you want to optimize, there are different kinds of profiles you may want to take.
- CPU Profile - A CPU profile tells you where your program is spending its time while in JavaScript. Remember that, while you can wait on asynchronous promises or callbacks, only one JavaScript expression is executed at a time. The CPU profile collects about 10,000 samples per second to tell you which expression--if any--is being run at that moment.
- Heap Profile - A heap profile tells you how memory is allocated over time in your program. Allocating memory can be costly, and reducing the amount of memory your code allocates can lead to performance wins.
- Heap Snapshot - A heap snapshot is an instantaneous view of where your program has allocated memory. If you notice your program is using a lot of RAM and want to find out where it's coming from, a heap snapshot can be useful. Note that collecting a heap snapshot can take several minutes for more complex programs, and viewing heap snapshots is not currently supported in the built-in editor.
Collecting a profile
To collect a profile, you'll need to be debugging your program. Once you are, you can collect a profile through a few methods:
- Using the 'record' button in the Call Stack view. This allows you to take CPU profiles, heap profiles, and heap snapshots.
- By calling
console.profile()in your program. This will collect a CPU profile.
Using the record button
Once you're debugging, switch to the Run and Debug view (⇧⌘D (Windows, Linux Ctrl+Shift+D)), and find the Call Stack view. Hover over the session you want to debug, and select the Take Performance Profile button. You can also run this command from the Command Palette (⇧⌘P (Windows, Linux Ctrl+Shift+P)).
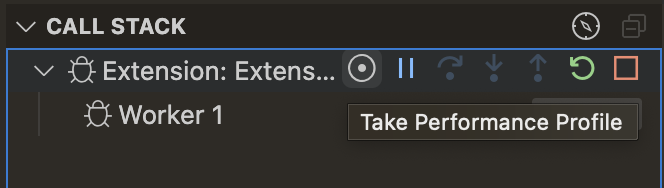
VS Code will then ask what type of performance profile you'd like to take; pick the one that's relevant for you.
Finally, VS Code will ask when you want to stop taking a profile. You can choose to either:
- Take the profile until you stop it manually.
- Take the profile for a set duration.
- Take the profile until you hit a certain breakpoint.
If you chose the first option, you can stop the profile by clicking the big red "record" icon shown in the debug toolbar. After the profile is collected, the profile viewer will open automatically.
Using console.profile
You can manually instrument your code using calls to console.profile to start a profile, and console.profileEnd to stop a profile. A CPU profile will be collected between these two call sites.
console.profile();
doSomeVeryExpensiveWork();
console.profileEnd();
The resulting .cpuprofile will be saved in your workspace folder automatically. You can select that file to open it in the built-in profile viewer.
Analyzing a profile
Table view
VS Code has an integrated visualizer that supports viewing JavaScript .cpuprofile and .heapprofile files. When you open one of these files, you will first be presented with a table view that looks something like this:
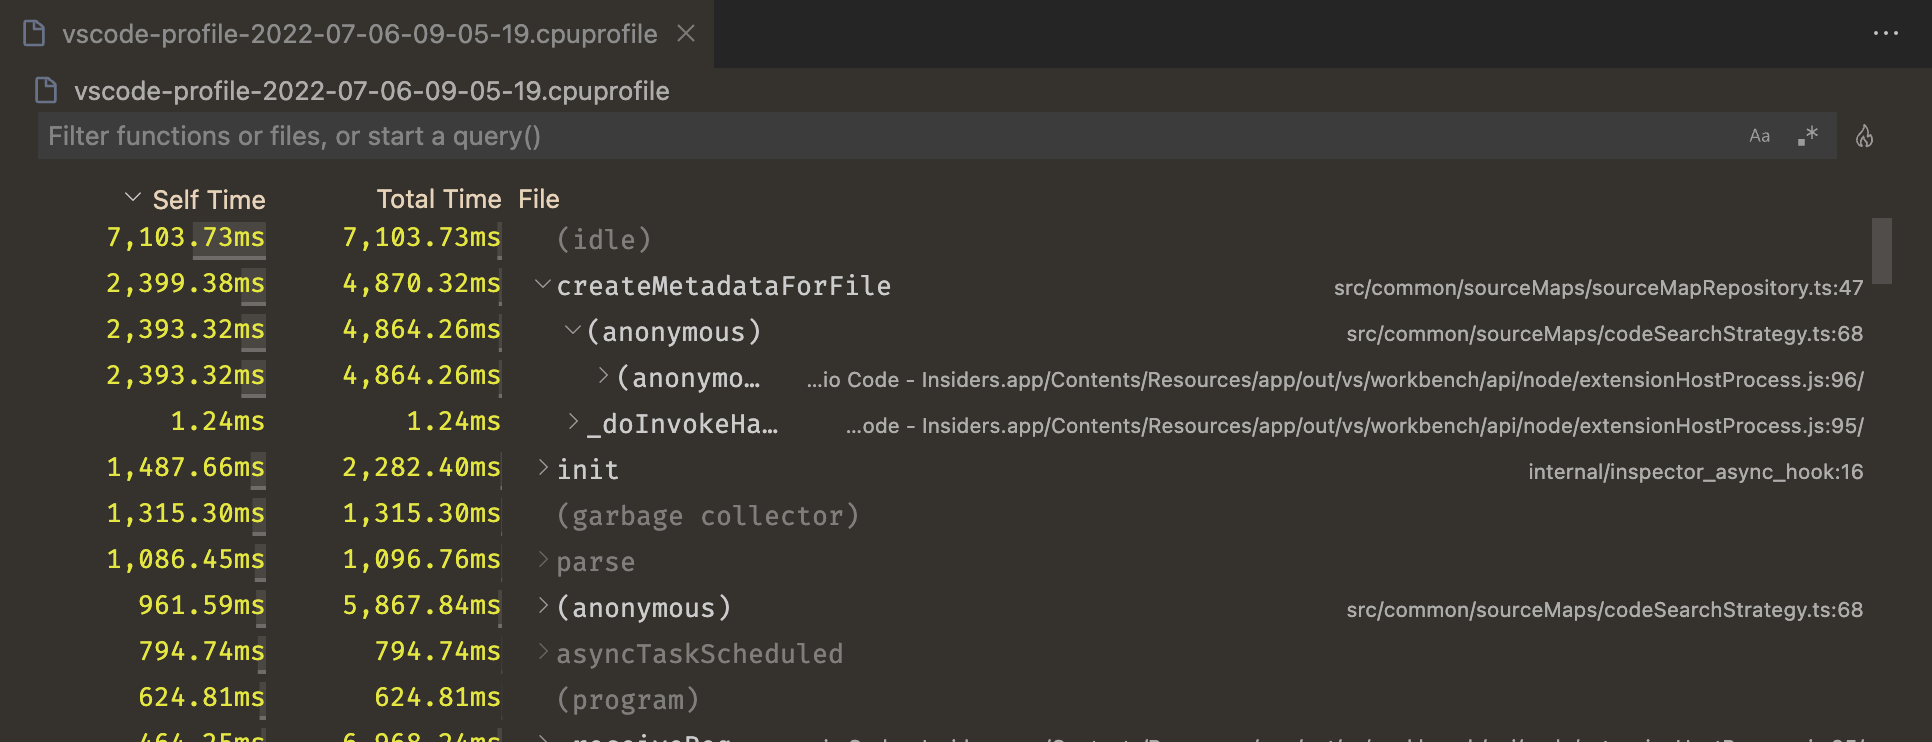
This is a bottom-up view of your program. Each row represents a function in your program, and by default they're ordered by how much time is spent in that specific function. This is also known as the "Self Time". The "Total Time" of a function is the sum of the time spent in that function and all functions that it calls. You can expand each table row to see where that function was called from.
For example, take the following code:
function a() {
  doSomethingFor5Seconds();
  b();
}

function b() {
  doSomethingFor3Seconds();
}

a();
In this case, the Self Time for a would be 5 seconds and the Total Time for a is 8 seconds. Both the Self Time and Total Time for b is 3 seconds. Heap profiles operate the same way, but use Self Size and Total Size to indicate the amount of memory that was allocated in each function, or its callees.
Flame view
The table view is nice for certain cases, but often you may want to see a more visual representation of the profile. You can do this by clicking the flame 🔥 icon in the top right-hand side of the table view. If you have not already, you'll be prompted to install an additional extension that provides the flame view editor.
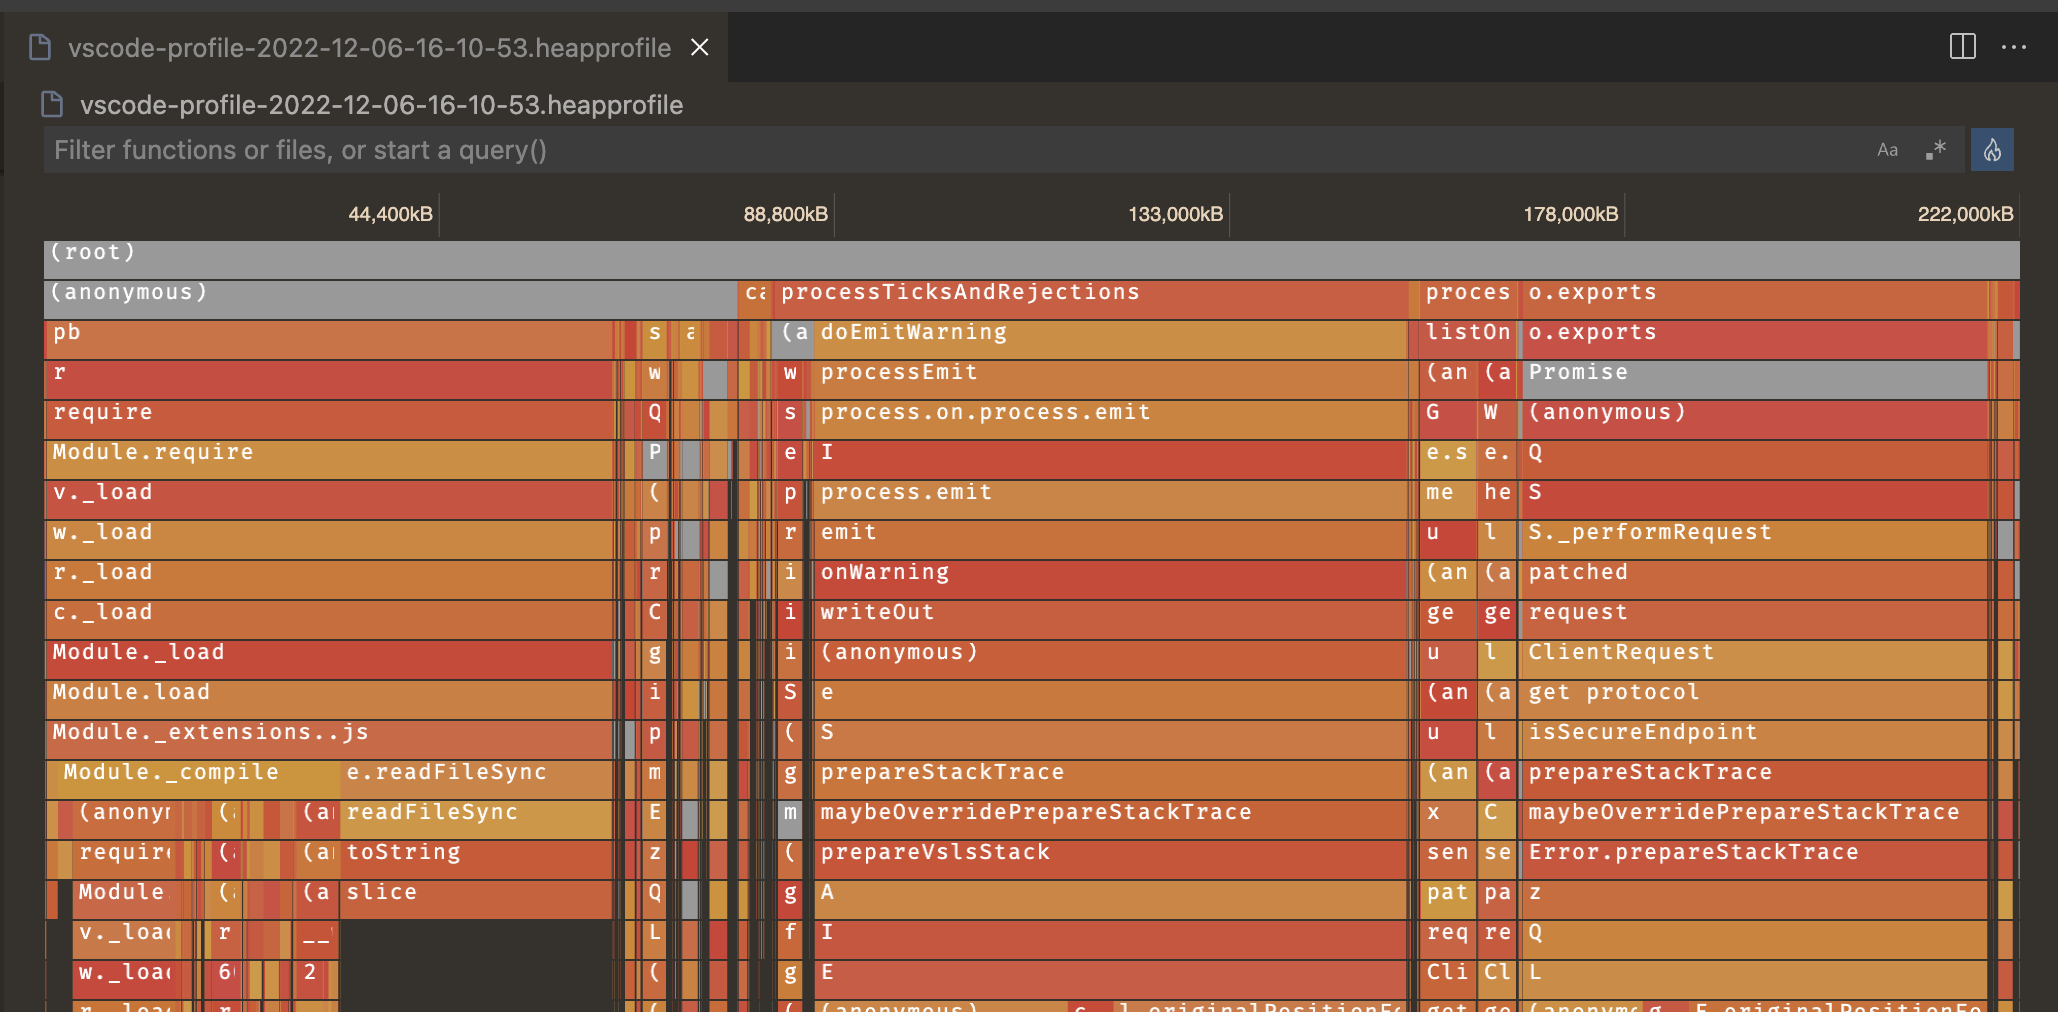
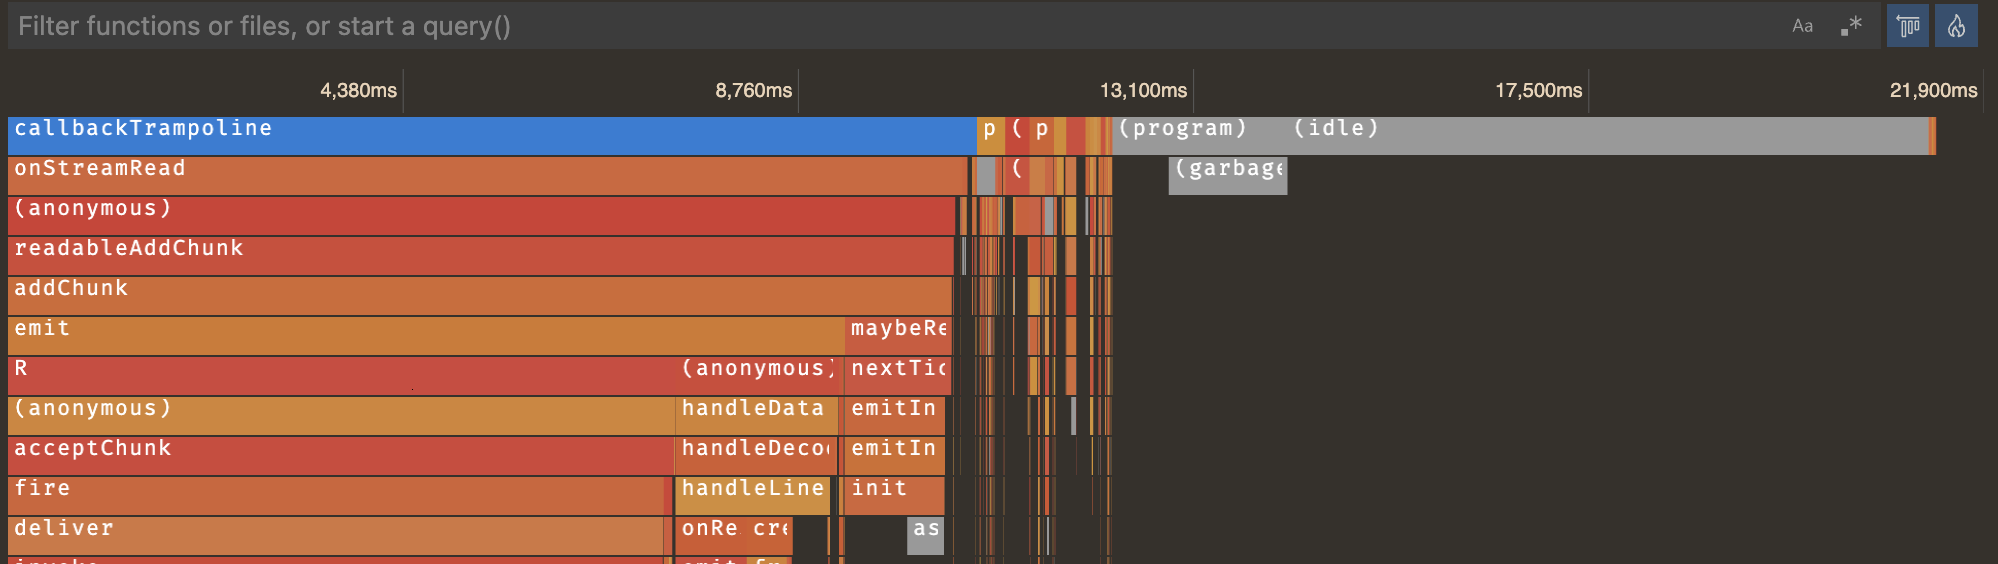
This might look confusing initially, but fear not, we'll make sense of it!
For CPU profiles, the horizontal axis is the timeline of the profile, allowing you to see what your program was doing at each moment in time. For heap profiles, the horizontal axis is the total memory allocated by the program.
Each bar, or 'flame', in the graph, is a call stack. The outermost, top-level function call (or, the 'bottom' of the call stack) is show at the top of the editor, and the functions that it calls are shown below. The width of the bar is determined by its Total Time or Total Memory.
You can click on an entry in the flame graph to view more information about it, and you can zoom in and out using the mouse wheel. You may also drag anywhere on the chart to navigate if you've zoomed in.
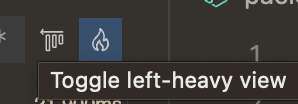
Left-heavy view
If you're working with a CPU profile, there's a good chance the flame graph you're looking at is not as understandable as the one above. You might have lots of individual call stacks that look like this:
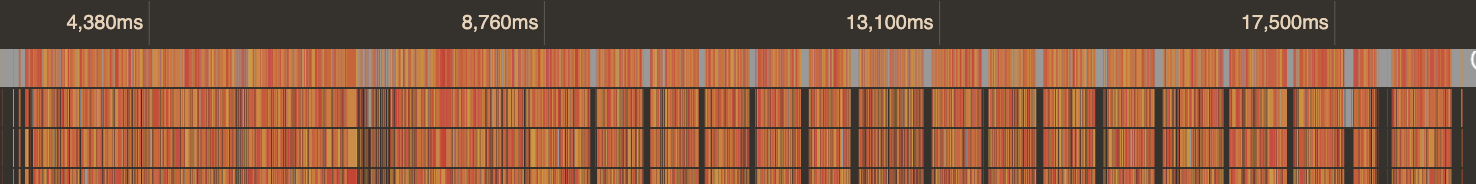
For easier analysis, VS Code profiles a "left-heavy" view that groups all similar call stacks together.
This switches from a chronological view of the profile to something more similar to the Heap Profile. The horizontal axis is still the total profile duration, but each bar represents the Total Time of that function call across all times it was called from that stack.
This view is much more useful for certain applications, such as servers, where individual calls may be relatively fast, but you want to find out what were the overall most costly functions across many invocations.