Profiling an app using Windows Machine Learning
Profiling is a tool designed to help developers and AI engineers to diagnose CPU, GPU, and NPU resource usage of processes, profile ONNX models on different execution providers, and capture Windows ML events.
In this article, you learn how to start profiling and how to inspect the resource usage view and the events view.
Prerequisites
- Install the latest version of Visual Studio Code.
- Install the Foundry Toolkit VS Code extension. For more information, see install Foundry Toolkit.
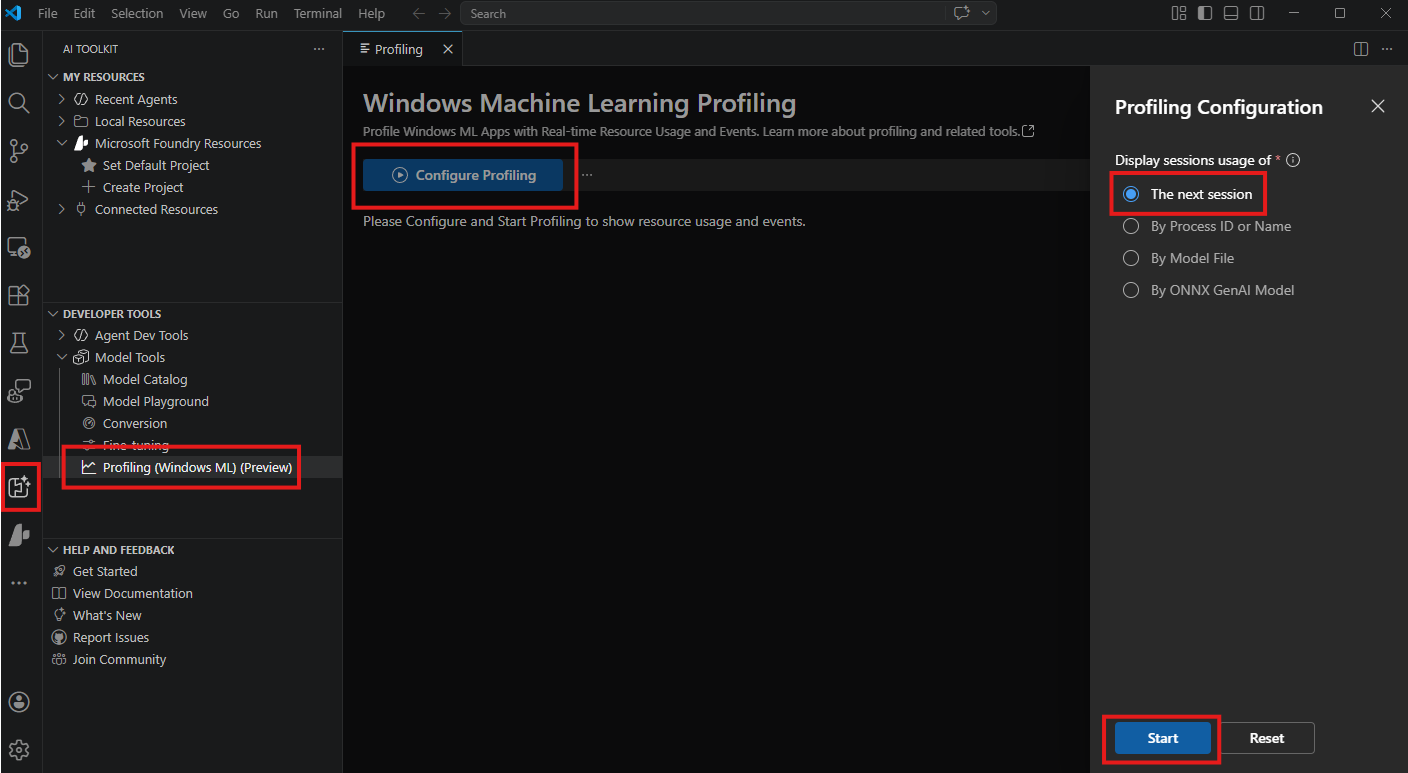
Profile on app startup
In this mode, the profiling tool profiles the next app that is started and that is sending out Windows ML events. This option is ideal for testing a run-once app. In this case, you start profiling, then run the app, and the resource usage will appear.
The tool starts profiling a newly started app. This means that for profiling a Python notebook, if the kernel is already running, you need to restart the kernel to begin profiling for it. Just starting a new notebook does not automatically start profiling.
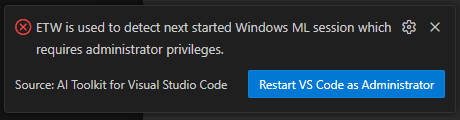
To receive Windows ML events, the tool needs to be run in admin mode. If VS Code is not started in admin mode, a notification shows up and guides you to restart VS Code. You need to close all other VS Code instances to make the restart in admin mode work.
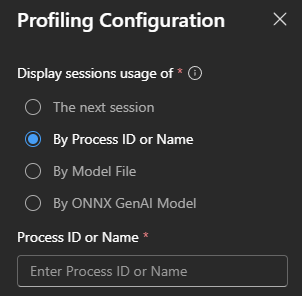
Profile a running app
In this mode, the profiling tool starts profiling an already running app. You can select a process based on these criteria:
- Process ID: like 12345
- Process name: usually the name of app without
.exe. The first match will be profiled. - Process path: like
c:\Users\xxx\Inference.Service.Agent.exe. The first match will be profiled.
This option is ideal for profiling an app that is already running and you're unable to restart it for profiling purposes.
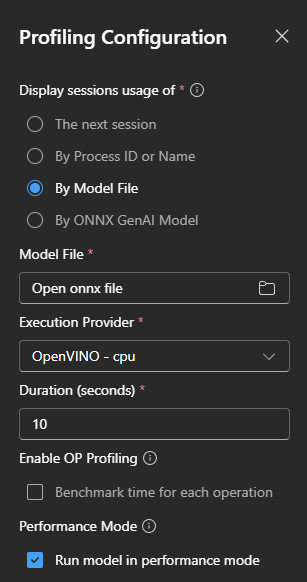
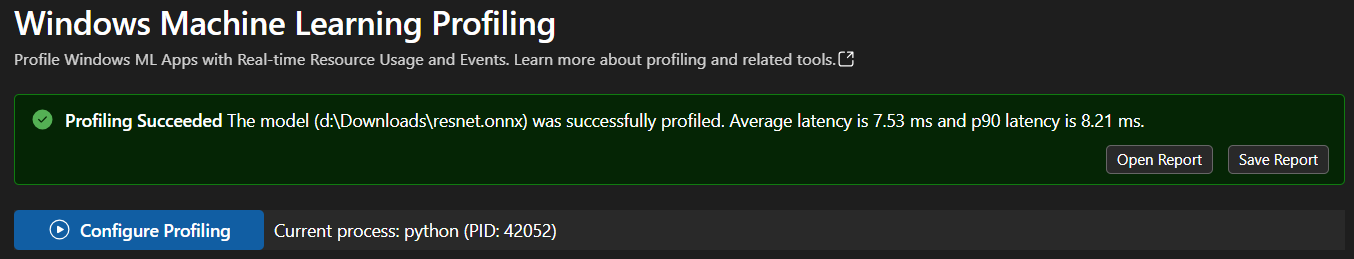
Profile an ONNX model
In this mode, the profiling tool starts profiling an ONNX model file on a target execution provider (EP) for a given duration. You can see the resource usage while it's running.
This option is ideal for profiling an ONNX model on different EPs.
After profiling, a notification shows up to guide you to open or save the report.
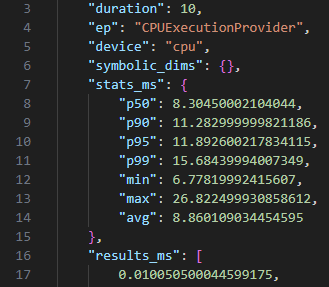
The report contains detailed profiling statistics and results for the ONNX model.
Benchmark time for each operation
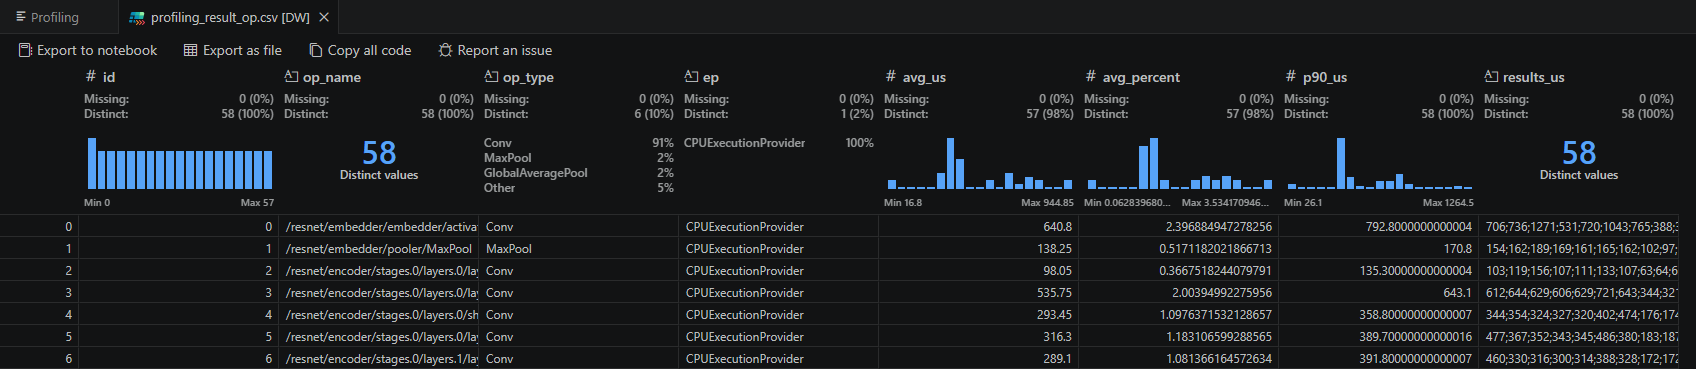
If OP Profiling is enabled, op level data will be generated to allow you to inspect the model in more detail.
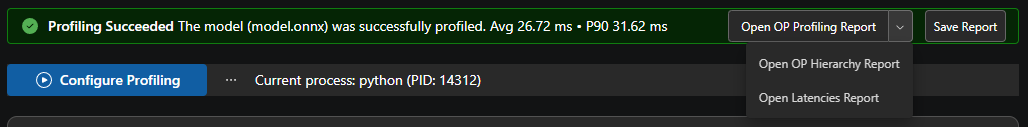
The report contains detailed latencies for each op.
Enable op level data for Intel (OpenVINO) EP
To see op level data when running on the Intel (OpenVINO) EP, do the following:
- Download Intel® Unified Telemetry
- Extract the content to a path like
C:\Users\XXX\Downloads\ut-tool-ext-v0.2.0-beta1.1 - In Foundry Toolkit settings, set
Model Lab Intel Unified Telemetry PathtoC:\Users\XXX\Downloads\ut-tool-ext-v0.2.0-beta1.1\bin
Intel Unified Telemetry requires administrator privileges to run. If VS Code is not running as administrator, profiling will prompt for elevation and open a new terminal window showing its progress. Don't close this window until the process has completed.
If VS Code is already running as administrator, you won't be prompted and no additional window will open.
Profile an ONNX GenAI model
In this mode, the profiling tool starts profiling an ONNX GenAI model on a target execution provider (EP) for a specified number of prompts. You can see the resource usage while it's running.
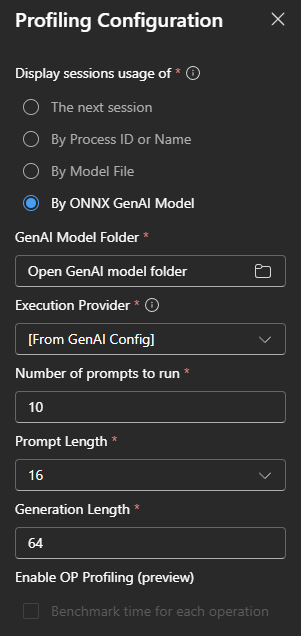
You need to select the folder of the GenAI model, this is the folder that contains genai_config.json.
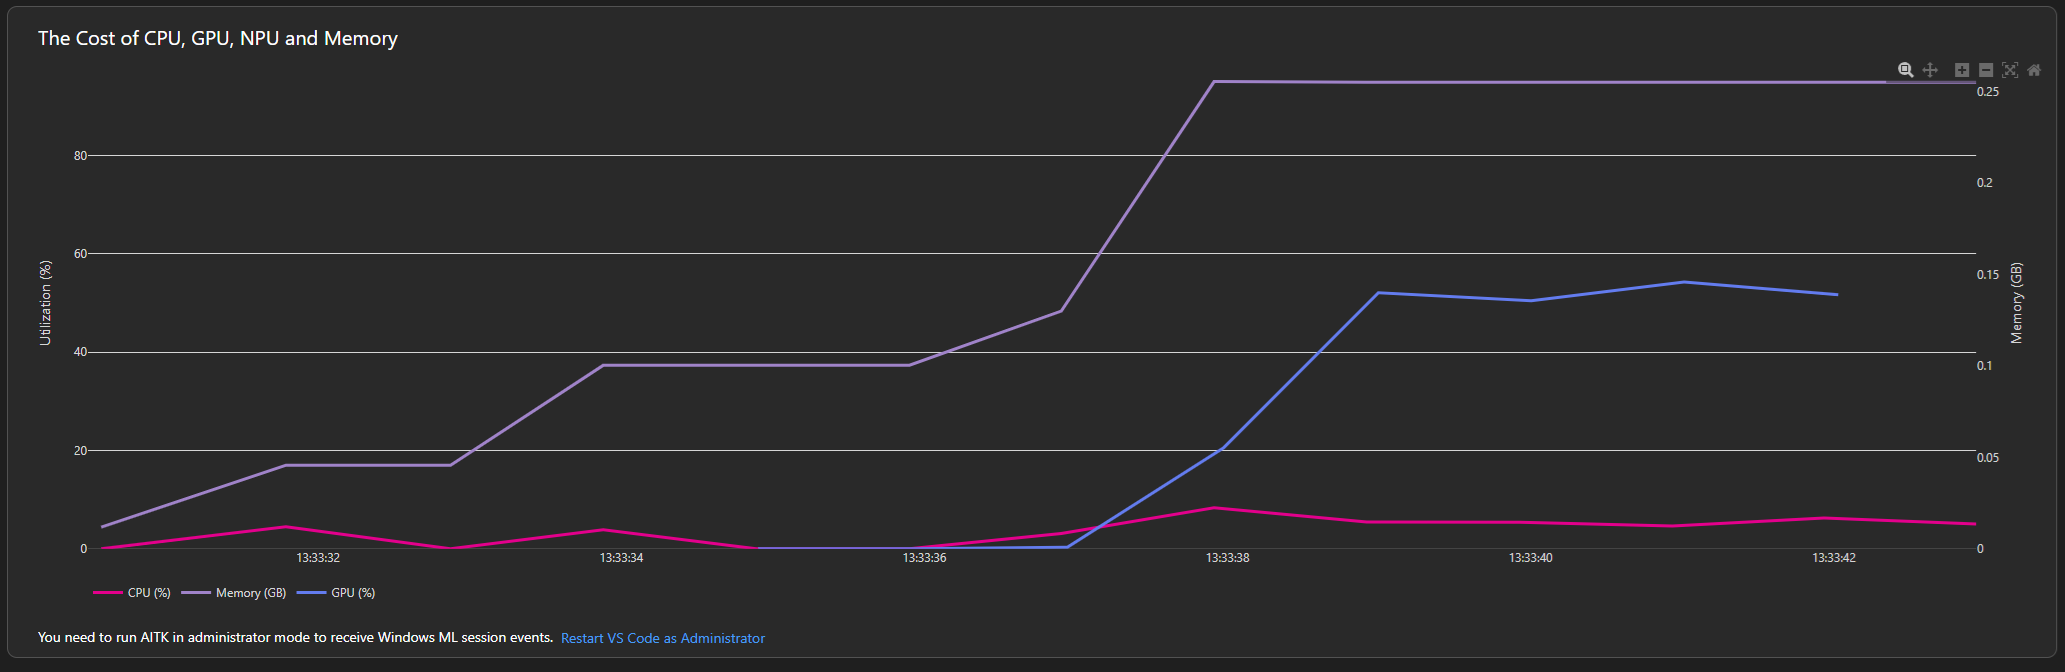
Resource Usage view
In the main window, the plot on the top shows usage of CPU, GPU, NPU, and memory. The usage is updated every second, and is kept for 10 minutes. You can use the tools on the top right to navigate the timeline by zooming in, zooming out, and panning.
This feature uses performance counters. To achieve higher accuracy, you could also try Windows Performance Recorder.
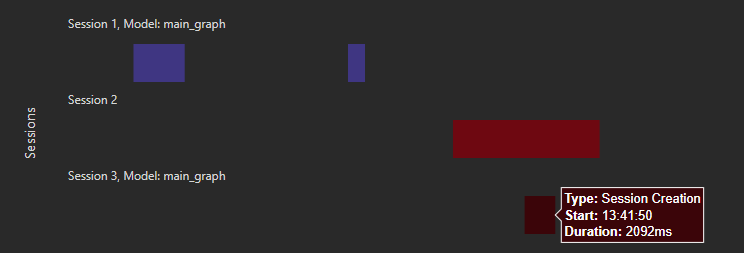
Windows ML Events view
In the main window, the plot on the bottom shows Windows ML events. Its timeline is synchronized with the Resource Usage view, so you can easily determine how resources are used when certain events occur.
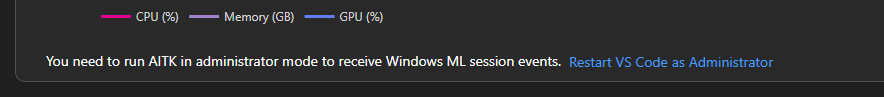
To receive Windows ML events, the tool needs to be run in admin mode. If VS Code is not started in admin mode, a notification shows up and guides you to restart VS Code. You need to close all other VS Code instances to make the restart in admin mode work.
Currently, only the following event types are shown:
- Ensure ExecutionProvider Ready: when Windows ML is preparing the EP
- Session Creation: when the session is created
- Inference: when the model runs inference on the session
What you learned
In this article, you learned how to:
- Start profiling in different ways
- Inspect the Resource Usage view
- Inspect the Windows ML Events view