Debug chat interactions
Visual Studio Code provides tools to help you understand what happens when you send a prompt to the AI. Use these tools to inspect how agents discover prompt files, invoke tools, make language model requests, and generate responses.
VS Code offers two complementary debugging tools:
- Agent Debug Log panel (Preview) shows a chronological event log of everything that happens during a chat session, including tool calls, LLM requests, prompt file discovery, and errors.
- Chat Debug view shows the raw details of each LLM request and response, including the full system prompt, user prompt, context, and tool invocation payloads.
Agent Debug Log panel
The Agent Debug Log panel is currently in preview.
The Agent Debug Log panel is the primary tool for understanding what happens when you send a prompt. It shows a chronological event log of agent interactions during a chat session, making it especially useful when debugging custom agents and orchestrated sub-agent workflows.
To open the Agent Debug Logs panel:
-
Enable the following setting:
- github.copilot.chat.agentDebugLog.fileLogging.enabled
-
Select the ellipsis (...) menu in the Chat view and select Show Agent Debug Logs.
-
Run Developer: Open Agent Debug Logs from the Command Palette.
You can switch between four views in the Agent Debug panel:
-
Logs: a chronological list of events during the session, with filtering options to focus on specific event types.
-
Agent Flow Chart: a flow chart that visualizes the interactions between agents and sub-agents during the session.
-
Summary: aggregate statistics about the session, such as total tool calls, token usage, error count, and overall duration.
-
Cache Explorer: a side-by-side diff of consecutive model requests that helps diagnose prompt-cache misses.
The Agent Debug Logs panel now shows both current and historical sessions. Logs are persisted locally on disk allowing you to view historical sessions.
Logs view
The Logs view shows a chronological list of events that occurred during the chat session. Each event includes a timestamp, event type, and summary information. You can expand each event to see more details, such as the full system prompt for an LLM request or the input and output for a tool call.
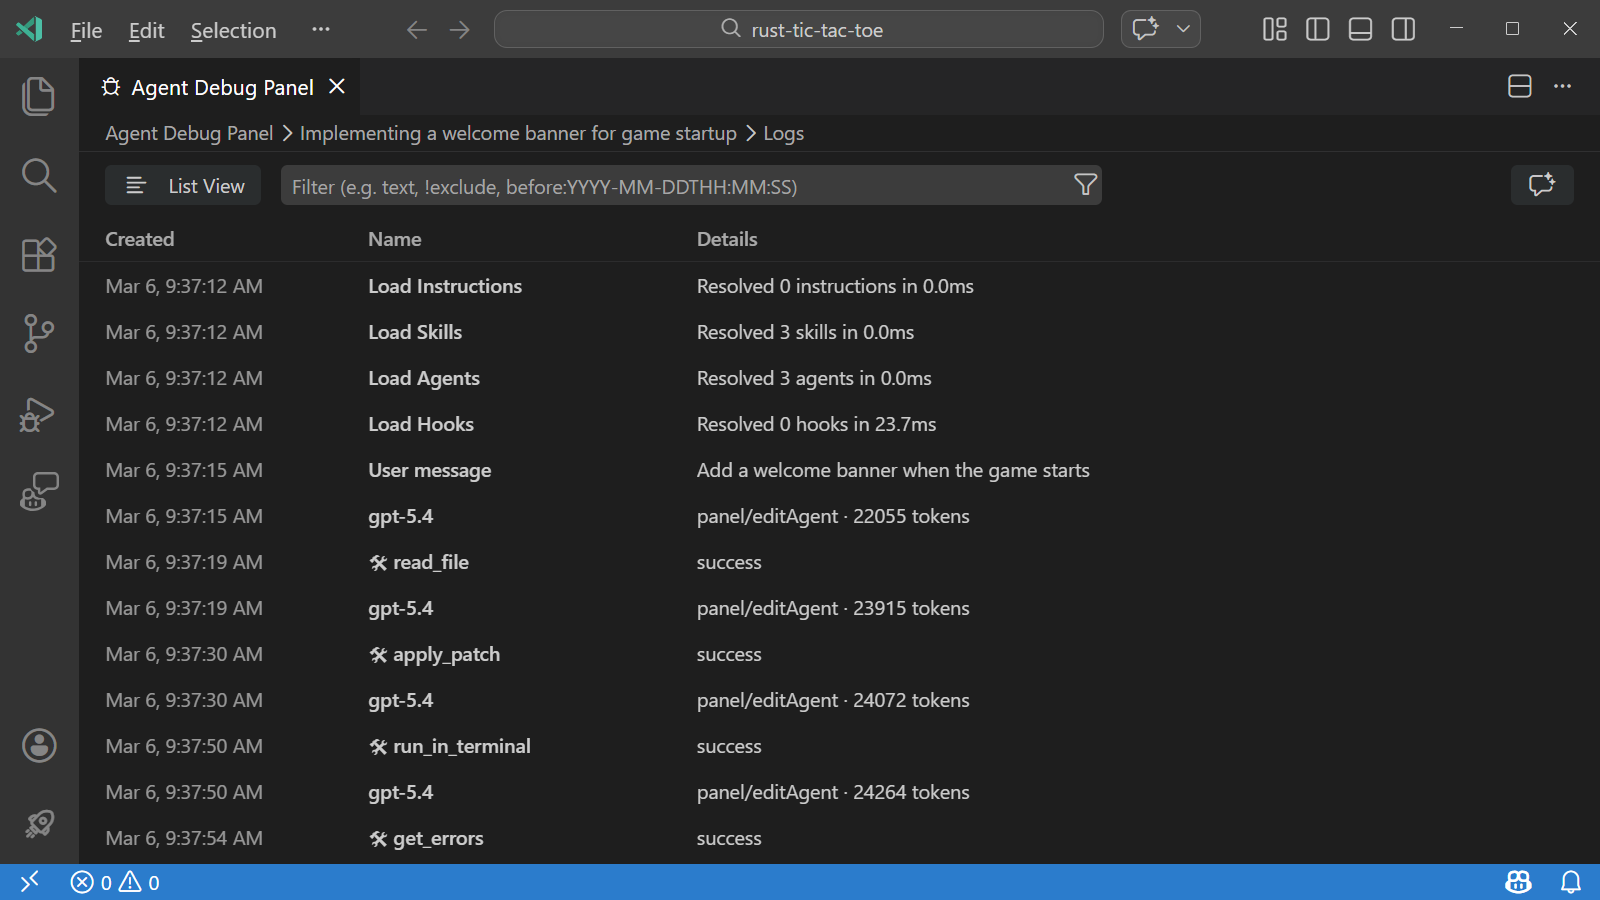
You can switch between a flat list and a tree view that groups events by subagent. Use the filter options to focus on specific events or event types.
The Logs view is the default view when you open the Agent Debug panel. You can also switch to the Logs view from the Summary view by selecting View Logs.
Summary view
The Summary view provides aggregate statistics about the chat session, such as total tool calls, token usage, error count, and overall duration.
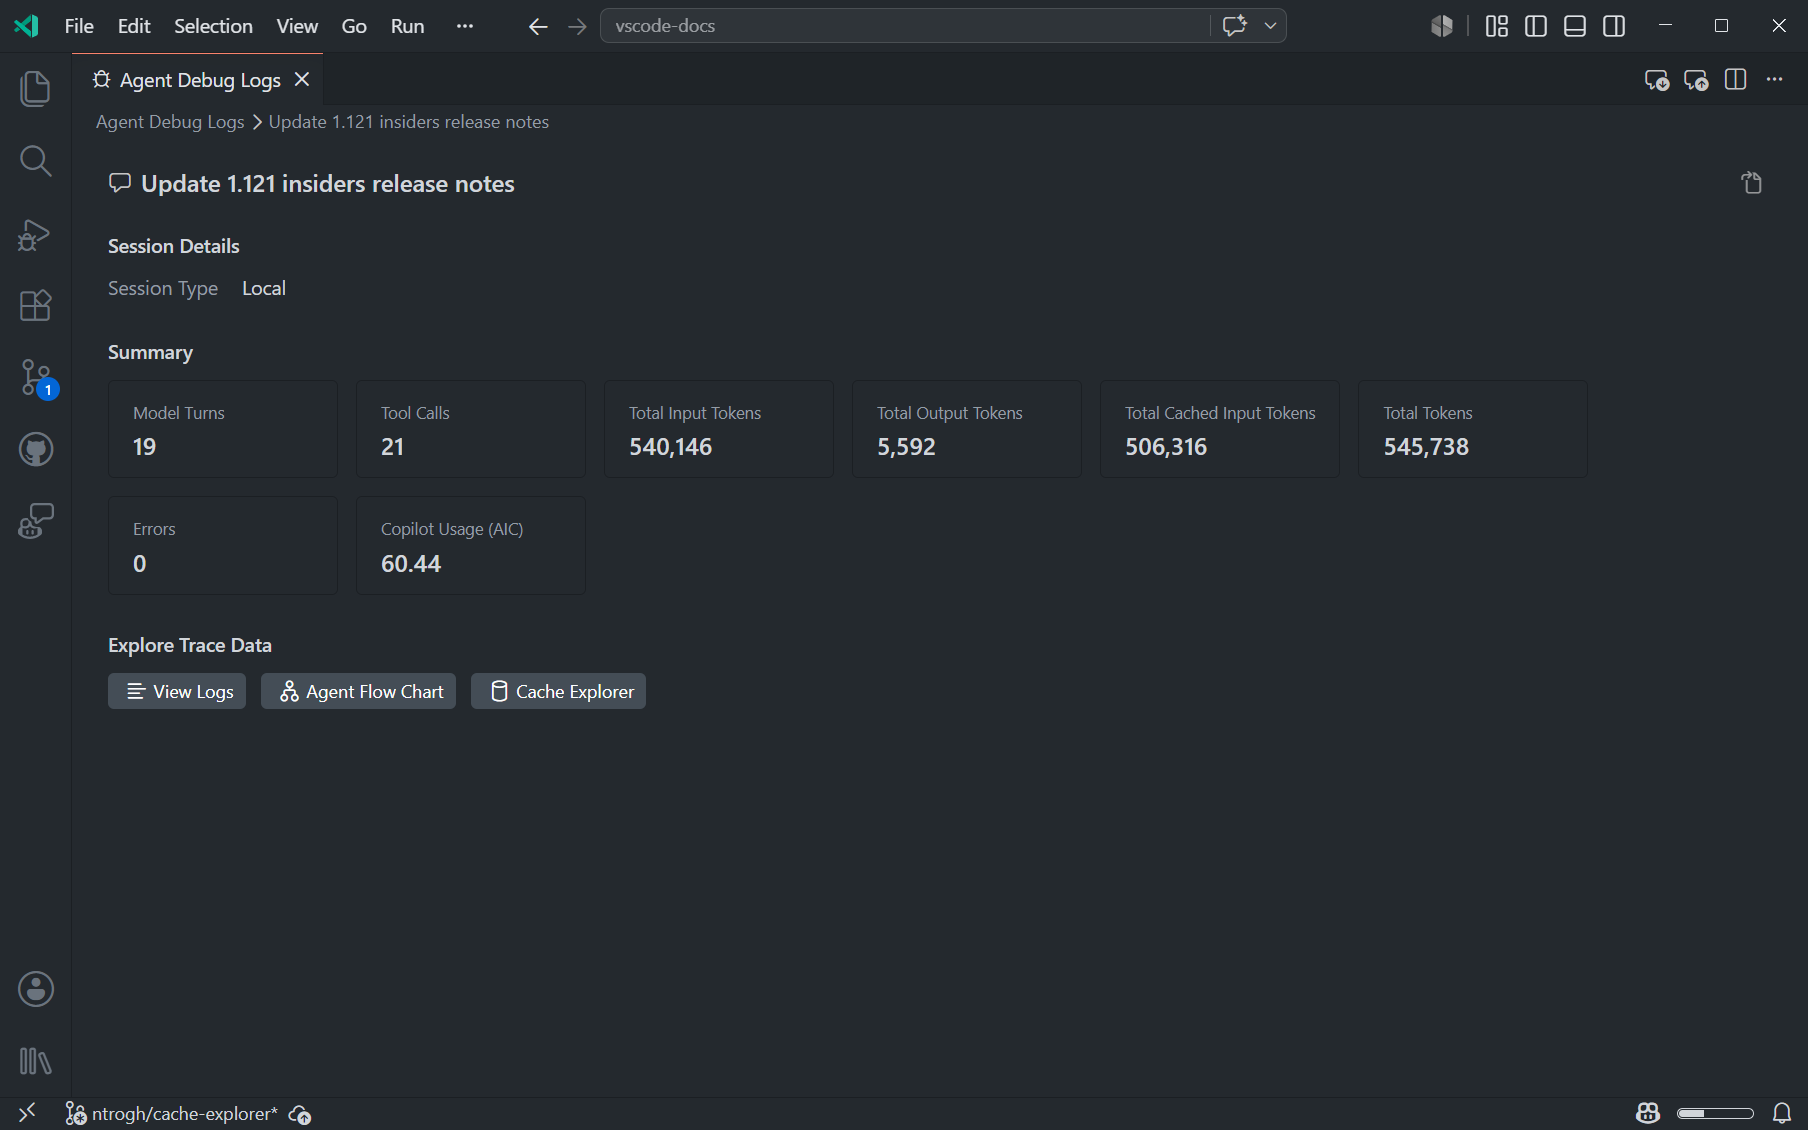
From the Summary view, you can select View Logs, Agent Flow Chart, or Cache Explorer to switch to one of those views.
To open the Summary view:
-
Open the Agent Debug panel by selecting the ellipsis (...) menu in the Chat view and selecting Show Agent Debug Logs.
-
Select the session description in the breadcrumb at the top of the panel.
Agent Flow Chart view
The Agent Flow Chart view visualizes the sequence of events and interactions between agents, making it easier to understand complex orchestrations.
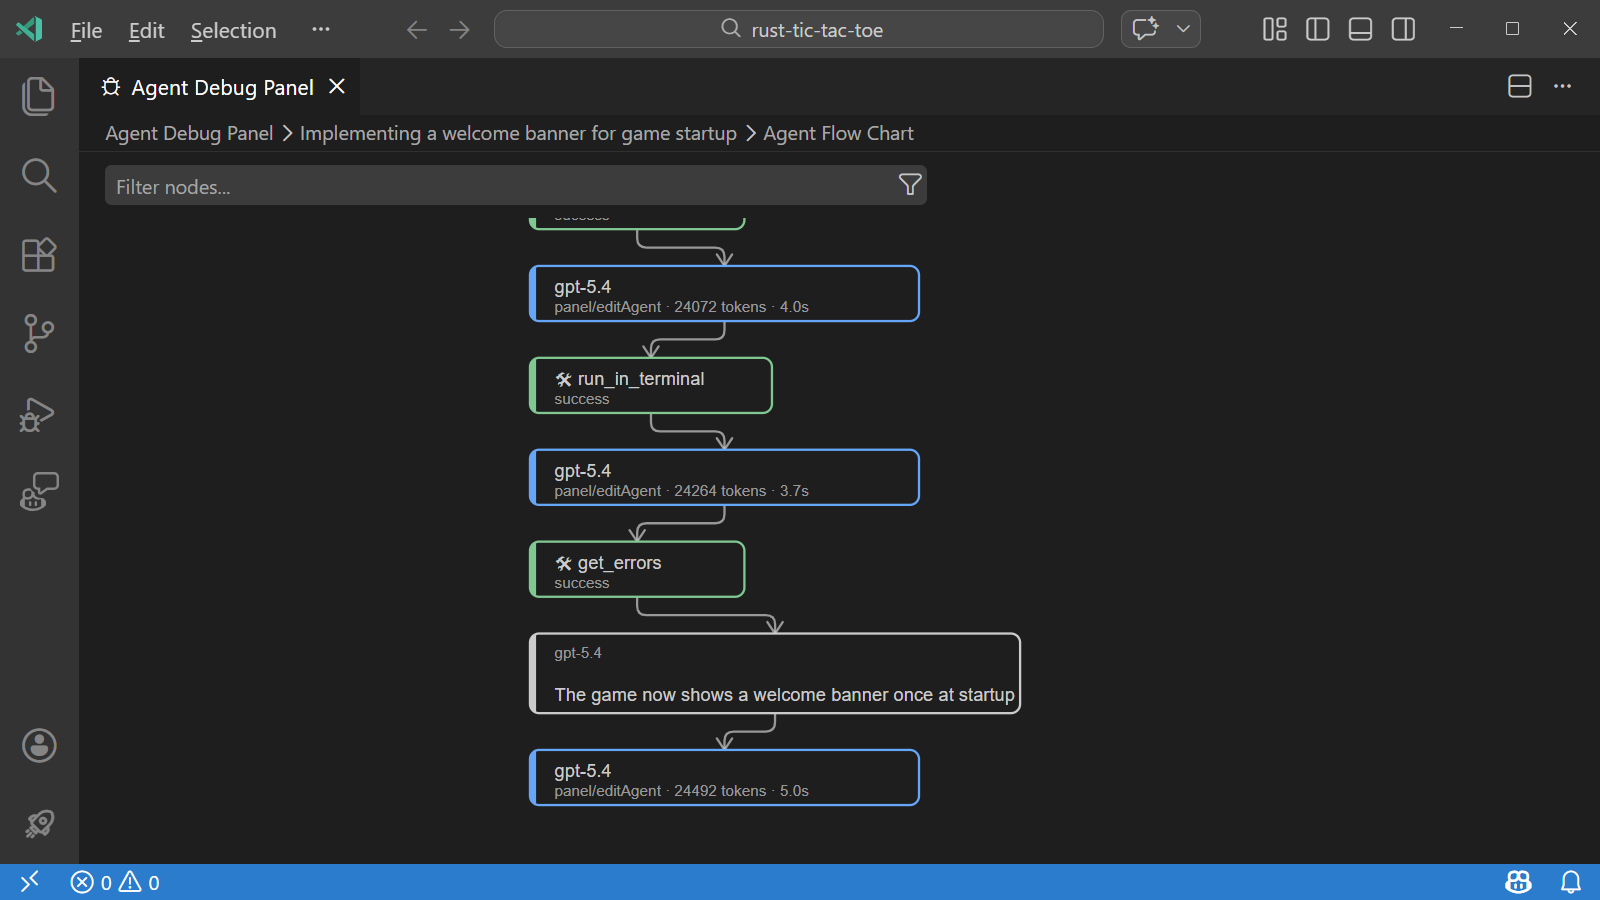
You can pan and zoom the flow chart and select any node in the flow chart to see details about that event.
To open the flowchart view, select Agent Flow Chart from the Summary view.
-
Open the Agent Debug panel by selecting the ellipsis (...) menu in the Chat view and selecting Show Agent Debug Logs.
-
Select the session description in the breadcrumb at the top of the panel.
-
Select Agent Flow Chart from the Summary view.
Cache Explorer view
The Cache Explorer view helps you diagnose prompt-cache misses by comparing consecutive model-turn requests in a session. Prompt caching lets language model providers reuse the prefix of a request that matches a previous one, which reduces latency and token costs. When the cache hit rate is low, the Cache Explorer pinpoints exactly where the prompt prefix diverges.
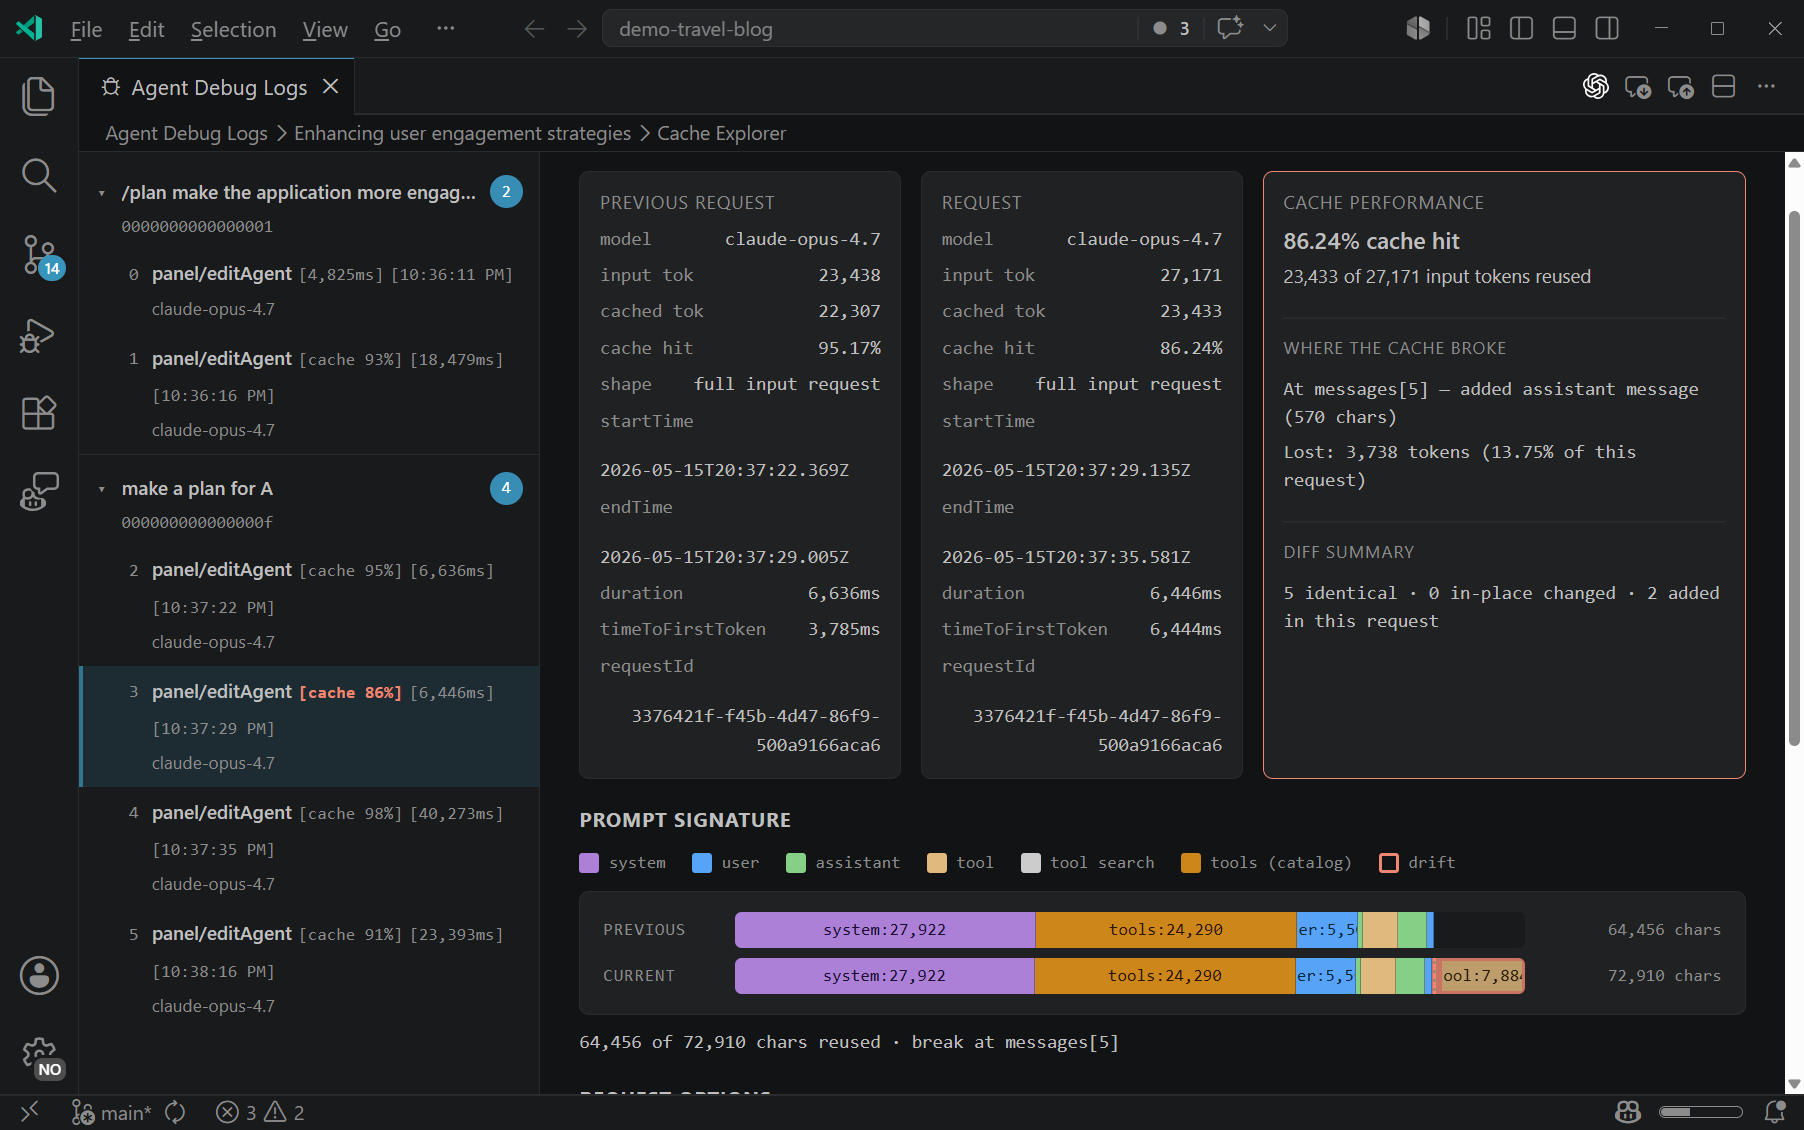
To learn how to open and read the Cache Explorer and how to improve your cache hit rate, see Diagnose prompt caching with the Cache Explorer.
Attach debug events to chat
You can attach a snapshot of the agent debug events to a chat conversation and ask the AI questions about the current session. This is useful for understanding token usage, which customizations loaded, what tool calls happened, and how long requests took.
To attach debug events to chat:
-
Open the Agent Logs view for your chat session
-
Select the sparkle icon in the top right of the Agent Debug panel. This opens the Chat view with the debug events snapshot attached as context.
Alternatively, you can use the /troubleshoot slash command to ask questions about a chat session directly, without opening the Agent Debug panel first. For example, type /troubleshoot list all paths you tried to load customizations or /troubleshoot how many tokens did you use in #session.
The /troubleshoot command requires the
github.copilot.chat.fileLogging.enabled
setting to be enabled.
Export and import sessions
You can export a debug session to a Open Telemetry JSON (OTLP format) file to share it with others or analyze it offline. You can also import a previously exported file to view it in the Agent Debug panel.
To export a session:
-
Open the Agent Debug Logs panel and navigate to the session you want to export.
-
Select the Export icon (download) in the top-right toolbar of the panel.
-
Choose a location to save the JSON file.
If no session is selected, VS Code shows a notification that there is no active debug session to export.
To import a session:
-
Select the Import icon (upload) in the top-right toolbar of the Agent Debug Logs panel.
-
Select a previously exported JSON file.
The imported session opens in the Agent Debug Logs panel with its overview and metrics, just like a live session.
Importing files larger than 50 MB shows a warning dialog with the actual file size. Consider trimming the file or exporting a shorter session if you encounter this warning.
Chat Debug view
The Chat Debug view shows the raw details of each AI request and response. Use it when you need to inspect the exact system prompt, user prompt, context, or tool response payloads sent to and received from the language model.
Open the Chat Debug view
To open the Chat Debug view:
- Select the overflow menu in the Chat view and select Show Chat Debug View.
- Run the Developer: Show Chat Debug View command from the Command Palette.
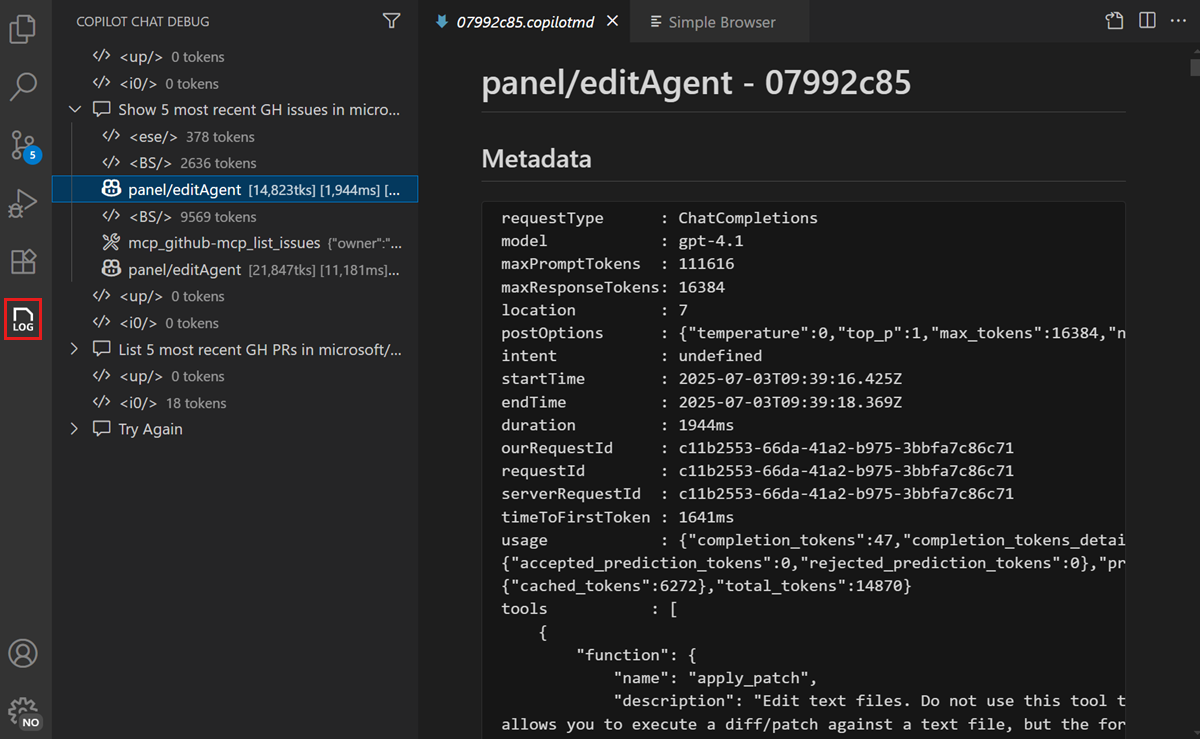
Read the debug output
Each interaction in the Chat Debug view contains expandable sections:
| Section | What it shows | What to look for |
|---|---|---|
| System prompt | The instructions that define the AI's behavior, capabilities, and constraints. | Verify that custom instructions or agent descriptions appear correctly. |
| User prompt | The exact text of your prompt as sent to the model. | Confirm your prompt was sent as expected, including any #-mentions resolved to actual content. |
| Context | Files, symbols, and other context items attached to the request. | Check that the expected files and context appear. If a file is missing, it might not have been indexed or the context window might be full. |
| Response | The full text of the model's response, including reasoning. | Review the raw response to understand how the model interpreted your request. |
| Tool responses | Inputs and outputs of tools invoked during the request. | Verify that tools received correct inputs and returned expected outputs. Useful for debugging MCP servers. |
You can expand each section to see the full details. This is particularly useful when using agents where multiple tools might be invoked as part of a single request.
Common troubleshooting scenarios
The AI ignores your workspace files
If the AI responds with generic information instead of referencing your codebase:
- Open Agent Logs and check for Discovery events to verify that workspace files were indexed.
- Open the Chat Debug view and check the Context section to verify that workspace files appear in the context. If they don't, check that workspace indexing is active.
- Try adding explicit
#-mentions (such as#fileor#codebase) to ensure the right files are included. Learn more about managing context.
An MCP tool is not being invoked
If the AI doesn't call an expected tool:
- Open Agent Logs and check the Tool calls filter to see if the tool was invoked or skipped.
- Open the Chat Debug view and check the System prompt section to verify the tool is listed in the available tools.
- If the tool is missing, verify that the MCP server is running and configured correctly.
- Try explicitly mentioning the tool with
#tool-namein your prompt.
The AI response is incomplete or cut off
If the response appears truncated:
- Check Agent Logs for LLM requests events to review token usage.
- A full context window might cause the model to truncate its response. Start a new chat session to reset the context.
A prompt file is not being applied
If a custom instruction or prompt file doesn't seem to take effect:
- Open Agent Logs and check the Discovery events to see if the file was loaded, skipped, or failed validation.
- Verify the file location and
applyTopattern match the current context. - See Debug chat interactions for more troubleshooting options.