Ruby in Visual Studio Code
Ruby is a dynamic, open-source programming language known for its simplicity and productivity. With an expressive and elegant syntax, part of the Ruby philosophy is to make developers happy. It is often used for web development with a range of different frameworks, and for scripting, allowing for fast iterations when building prototypes.
This topic goes into detail about setting up and using Ruby within Visual Studio Code, with the Ruby LSP extension.
Installation
Install Ruby through a version manager
While Ruby is installed by default on some operating systems (such as macOS and some distributions of Linux), we recommend using a version manager such as rbenv to be able to access newer versions of Ruby on Windows, macOS, and Linux. Follow the installation guidance for your platform.
Note: As with installing any new toolset on your machine, you'll want to make sure to restart your terminal/Command Prompt and VS Code instances to use the updated toolset location in your platform's PATH variable.
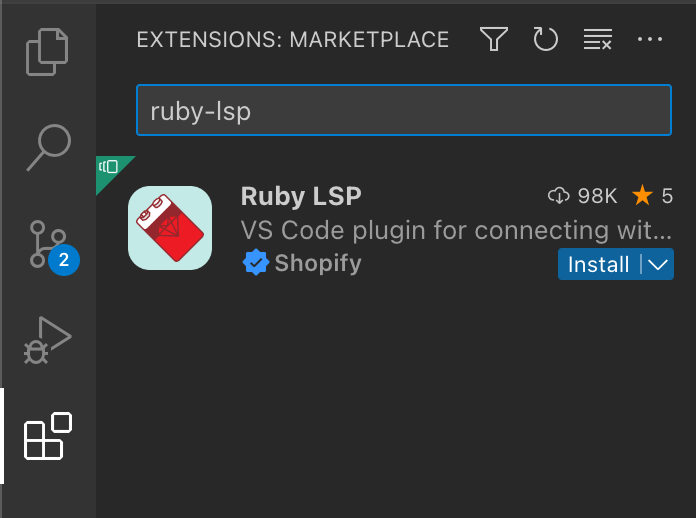
Install the Ruby LSP extension in VS Code
You can find and install the Ruby LSP extension from within VS Code via the Extensions view (⇧⌘X (Windows, Linux Ctrl+Shift+X)) and searching for 'Ruby LSP'.
We'll discuss many of Ruby LSP features in this topic but you can also refer to the extension's documentation and repository.
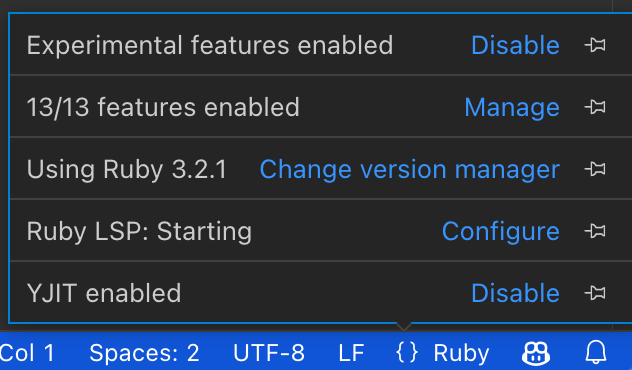
Check your installation
After installing, check the language status item to see the status of the Ruby LSP server. If the version manager has been configured, it should display the right Ruby version for your project. The server status should display starting or running, but not error.
The extension generates a .ruby-lsp folder automatically with a custom bundle that includes the language server gem ruby-lsp. No configuration should be required.
By default, the extension tries to automatically detect the Ruby version manager you're using and use the right versions and paths accordingly. If you want to customize that behavior, set the following configuration in your user settings:
{
  "rubyLsp.rubyVersionManager": {
    "identifier": "rbenv"
  }
}
The extension will automatically try to update the ruby-lsp language server gem periodically; if you want to force that to happen, use the Command Palette (⇧⌘P (Windows, Linux Ctrl+Shift+P)) to execute Ruby LSP: Update language server gem.
If you have any problems, see troubleshooting for next steps.
Main features
Navigation and IntelliSense
The Ruby LSP provides several navigation and IntelliSense related features, such as go to definition, hover, workspace symbol, document symbol, completion and signature help.
To learn more about moving quickly through your source code with VS Code, check out Code Navigation.
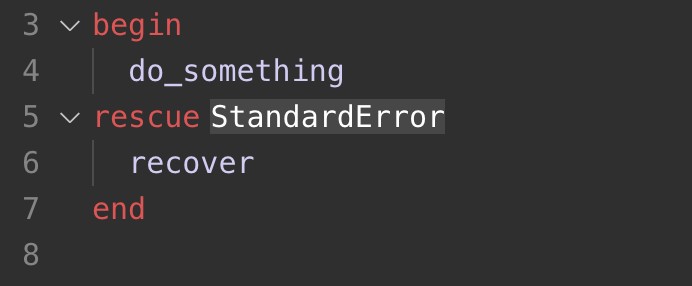
Inlay hints
Ruby LSP is able to display useful information about inferred or implicit values in your code. In the example below, you can see StandardError being shown as the implicit exception class being rescued in an empty rescue call.
While inlay hints can be helpful for understanding your code, you can also disable the feature via the Editor > Inlay Hints: Enabled setting (editor.inlayHints.enabled) or use the following to disable this feature only for Ruby LSP:
"rubyLsp.enabledFeatures": {
    "inlayHint": false,
}
Semantic syntax highlighting
Ruby LSP is able to use semantic syntax highlighting and styling due to its rich understanding of a project source code.
For example, it can highlight:
- Method invocations consistently, without confusing it with local variables.
- Local arguments (such as method, block or lambda arguments) consistently inside the scope in which they exist.
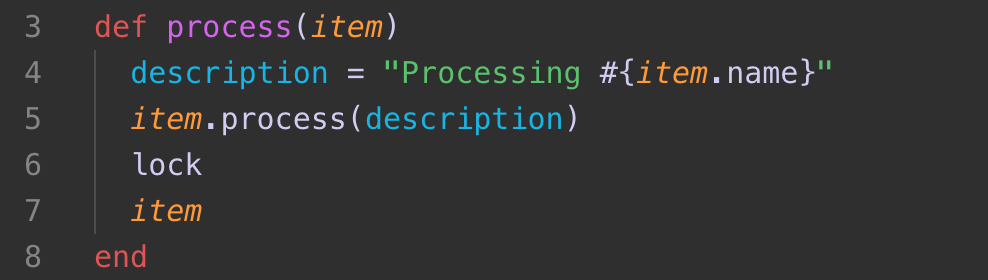
Note: This screenshot is using the Spinel theme included in the Ruby extension pack. Themes must use the information surfaced by the Ruby LSP in order to provide rich highlighting for Ruby files.
To use this feature, the editor must have semantic highlighting enabled.
"editor.semanticHighlighting.enabled": true,
Linting and formatting
By default, Ruby LSP provides linting and formatting through an integration with RuboCop. You can format your Ruby file using ⇧⌥F (Windows Shift+Alt+F, Linux Ctrl+Shift+I) or by running the Format Document command from the Command Palette (⇧⌘P (Windows, Linux Ctrl+Shift+P)) or the context menu in the editor.
If your project does not use RuboCop, the Ruby LSP will format files using SyntaxTree.
You can also run the formatter on each save (Editor: Format On Save) to keep your Ruby code properly formatted automatically while you are working. To do that, you must enable format on save.
"editor.formatOnSave": true
The Ruby LSP extension also provides some convenient completions using format on type. For example, it will auto-continue comment lines and auto-close end tokens, pipes, or string interpolation curly braces. To use format on type, make sure it's enabled in the editor with:
"editor.formatOnType": true
Quick Fixes
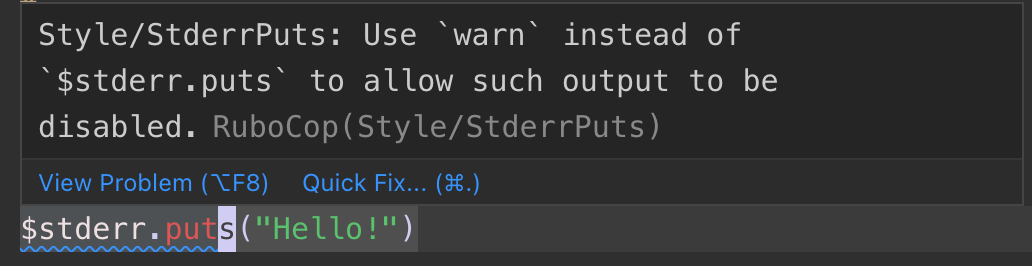
When the linter finds errors and warnings in your source code, Ruby LSP can often provide suggested Quick Fixes (also called Code Actions), which are available via a light bulb hover in the editor. You can quickly open available Quick Fixes via the ⌘. (Windows, Linux Ctrl+.).
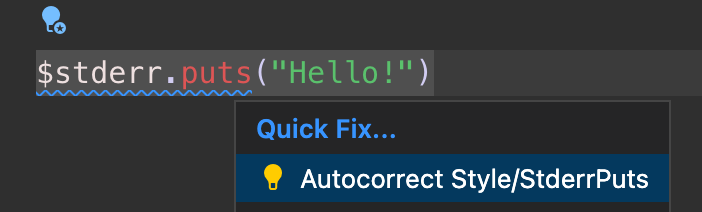
Additionally, Code Action Widget: Include Nearby Quick Fixes (editor.codeActionWidget.includeNearbyQuickFixes) is a setting that is enabled on default, which will activate the nearest Quick Fix in a line from ⌘. (Windows, Linux Ctrl+.) (command ID editor.action.quickFix), no matter where your cursor is in that line.
The command highlights the source code that will be refactored or fixed with Quick Fixes. Normal Code Actions and non-fix refactorings can still be activated at the cursor location.
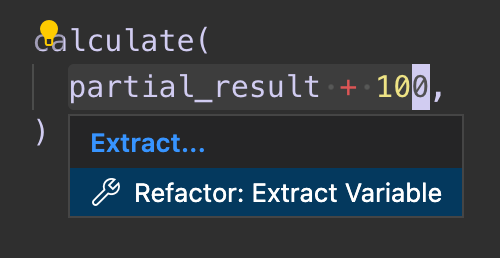
Refactoring
In addition to Quick Fixes, the Ruby LSP also provides refactor options through Code Actions. For example, it can extract a Ruby expression into a local variable with a single click.
Debugging
The Ruby LSP extension supports debugging using the debug gem (Ruby's official debugger). Alternatively, developers can also install the VS Code RDBG extension to get debugging functionality.
The following documentation is for the Ruby LSP's debugger client. Please refer to RDBG's README for instructions on how to configure it.
Debugging tests
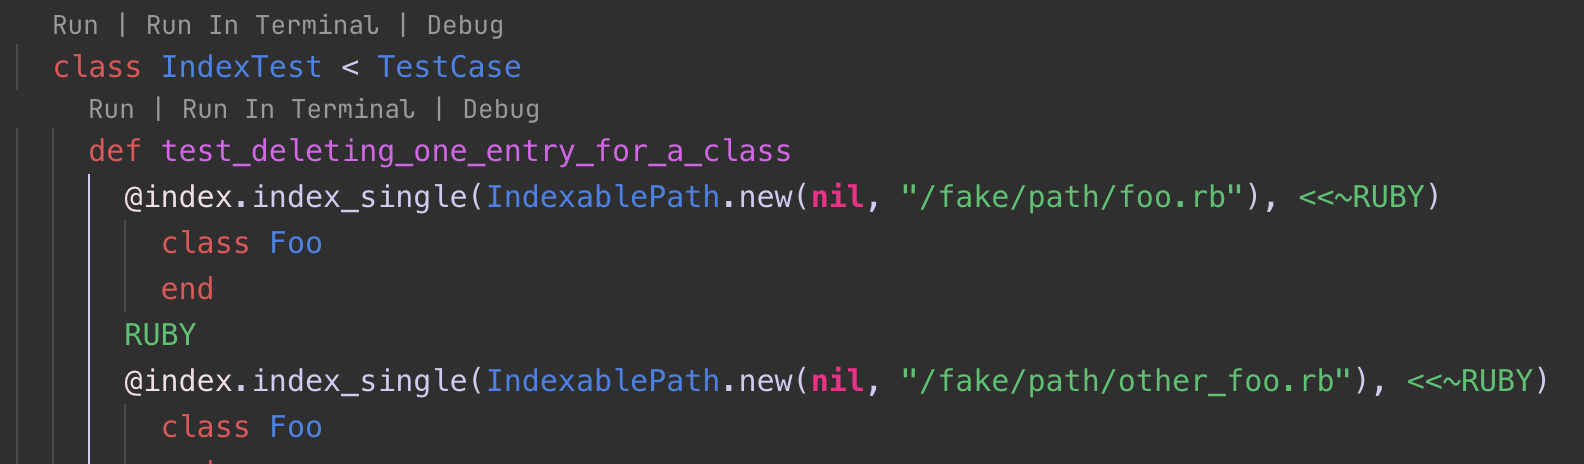
The Ruby LSP adds CodeLens buttons on top of unit tests that enable you to run examples in the Test Explorer, run them in a new terminal or launch the debugger. For these uses, no configuration is required.
Debugging through launch tasks
To use the debugger through launch tasks, you will need to create debugging configurations
in a launch.json file. The configuration lets you configure the program to be executed.
To create a launch.json for a Ruby program:
- In the Debug view (⇧⌘D (Windows, Linux Ctrl+Shift+D)), select the create a launch.json file link.
- This displays a dropdown with several default launch configuration types. You can pick the first option, but we'll add more configurations.
- We can now edit the created
.vscode/launch.jsonfile to add more ways to launch your Ruby program for debugging.
Example:
{
  "version": "0.2.0",
  "configurations": [
    // Launch the debugger for any given program. In this case, it will run the current file using Ruby
    {
      "type": "ruby_lsp",
      "name": "Debug",
      "request": "launch",
      "program": "ruby ${file}"
    },
    // Launch the debugger for the current test file
    {
      "type": "ruby_lsp",
      "request": "launch",
      "name": "Debug test file",
      "program": "ruby -Itest ${relativeFile}"
    },
    // Attach the debugger client to an existing Ruby process that has already been launched with the debugger
    // server
    {
      "type": "ruby_lsp",
      "request": "attach",
      "name": "Attach to existing server"
    }
  ]
}
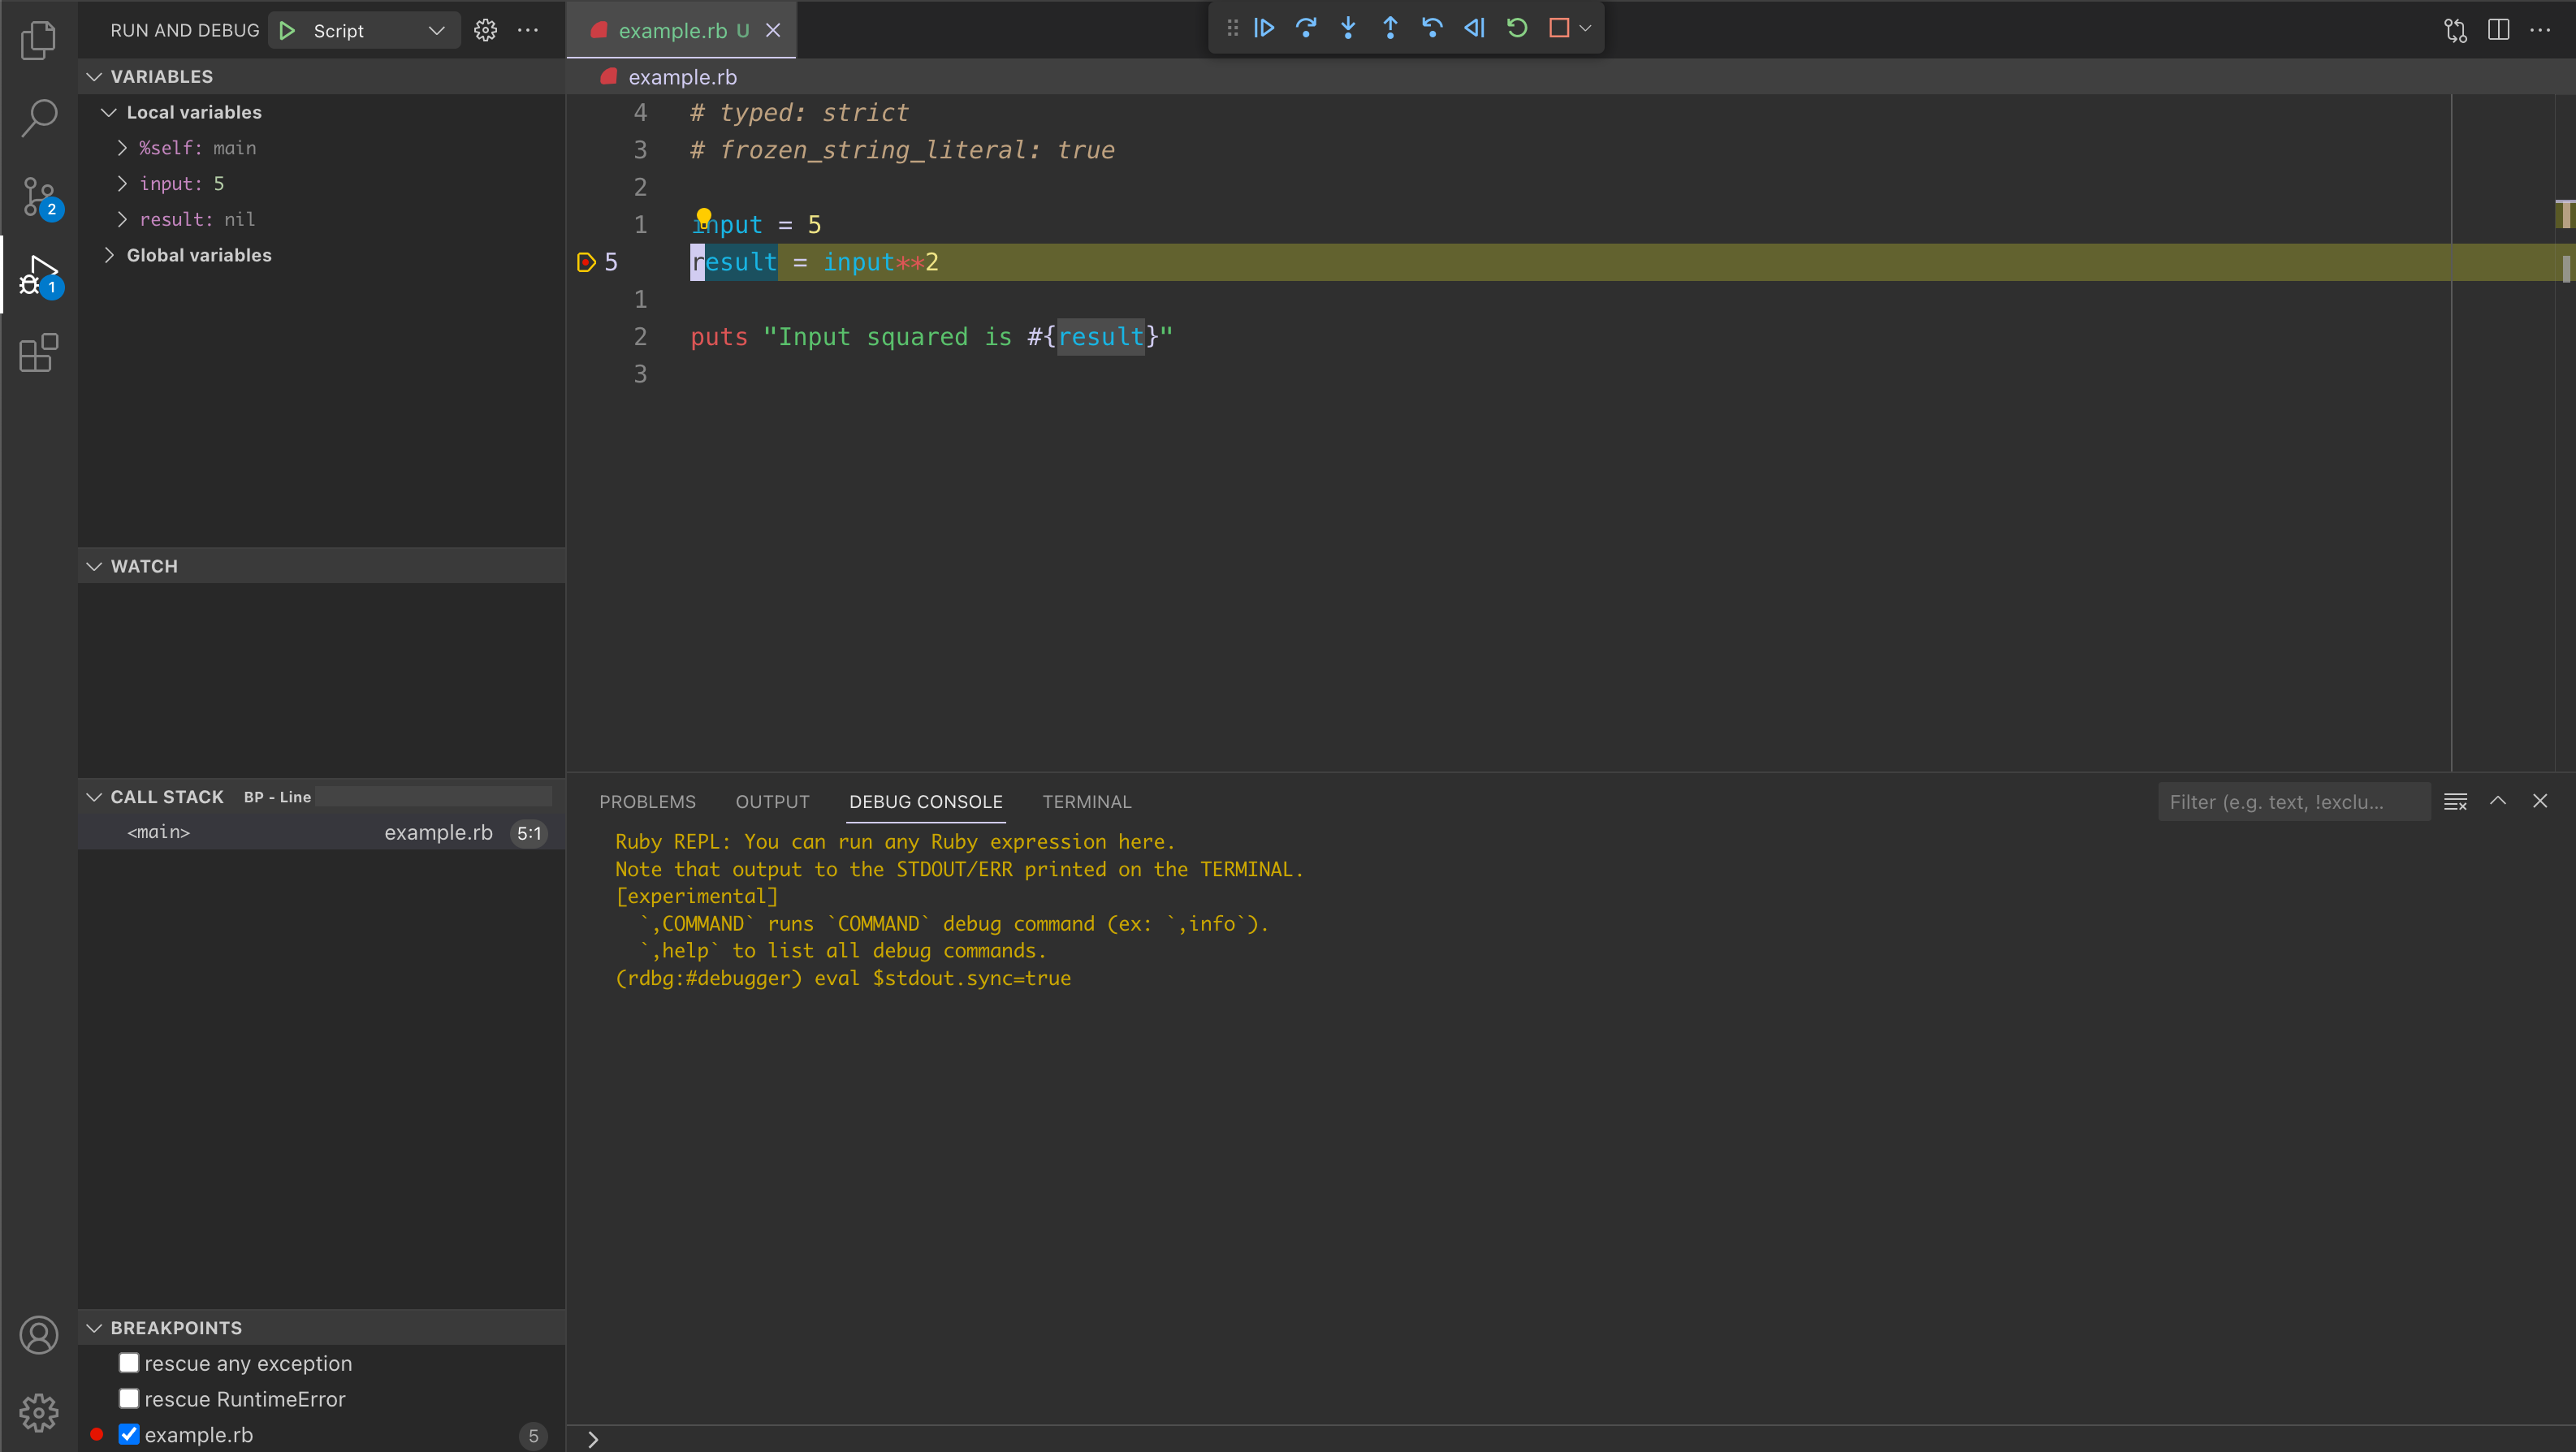
After adding the launch configurations, we can debug Ruby programs by adding breakpoints and executing our launch tasks.
-
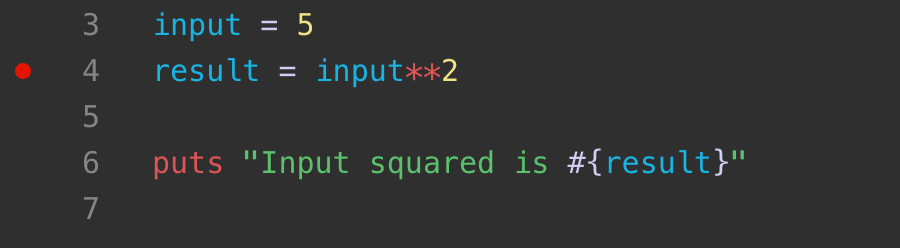
Open a Ruby file and click the left gutter in the editor to set a break point. It should display as a red dot.
-
Start debugging by selecting the desired task under Run and Debug and clicking the start debugging button (default keyboard shortcut F5).
Next steps
This has been a brief overview showing the Ruby LSP extension features within VS Code. For more information, see the details provided in the Ruby LSP documentation, including how to tune specific VS Code editor configurations.
To stay up to date on the latest features/bug fixes for the Ruby LSP extension, see the Releases page for the monorepo, which includes both the server and VS Code extension implementations.
If you have any issues or feature requests, feel free to log them in the Ruby LSP's GitHub repo.
If you'd like to learn more about VS Code, try these topics:
- Basic Editing - A quick introduction to the basics of the VS Code editor.
- Install an Extension - Learn about other extensions are available in the Marketplace.
- Code Navigation - Move quickly through your source code.