Testing
Visual Studio Code provides a rich set of features for testing your code. You can automatically discover tests in your project, run and debug your tests, and get test coverage results. GitHub Copilot in VS Code can assist with setting up the testing framework for your project, and help you generate test code and fix failing tests.
In this article, you'll learn how to start with testing in VS Code, find popular testing extensions, and explore the testing features. You'll also learn how Copilot in VS Code can help you write tests faster and can assist you in fixing failing tests.
If you don't have a Copilot subscription yet, use Copilot for free by signing up for the Copilot Free plan. You'll get a monthly allowance of inline suggestions and AI credits.
About testing in VS Code
Testing support in VS Code is language-specific and depends on the testing extensions you have installed. Language extensions or standalone extensions can implement the testing features for a particular language or testing framework.
VS Code has the following features for testing your code:
-
Support multiple testing frameworks: language extensions and standalone testing extensions provide support for various languages and test runners, such as Jest, Mocha, Pytest, JUnit, and more.
-
Centralized test management: the Test Explorer provides a centralized place to manage and run the tests in your project. The Test Explorer might automatically discover the tests in your project, depending on the testing extension.
-
Integrated test results: view the test status inline in the editor alongside the test code, or view all tests in the Test Explorer. Detailed test results are available in the Test Results panel.
-
Debugging: debug your tests to diagnose test failures. Take advantage of the rich debugging support in VS Code, such as breakpoints, watch variables, and more.
-
Test coverage: run tests with coverage to see how much of your code is covered by your tests.
-
AI-assisted testing: use GitHub Copilot in VS Code to assist you with setting up your testing framework, generating test code, and fixing failing tests.
-
Task integration: make your testing work easier by creating tasks to run your tests. You can also run your tests in the background when you change your code.
Get started with testing in VS Code
To get started with testing in VS Code, follow these steps:
-
Open the Extensions view and install a testing extension for your project. Filter the extensions by the Testing category (@category:"testing").
-
Select the beaker icon () in the Activity Bar to open the Test Explorer and discover the tests in your project.
-
Run and debug your tests from the Test Explorer or directly from the editor.
Extensions for testing
You can find extensions that support testing by looking in the Visual Studio Marketplace. You can also go to the Extensions view (⇧⌘X (Windows, Linux Ctrl+Shift+X)), and filter by the Testing category.
Copilot can assist with setting up a testing framework and suggesting relevant testing extensions. Open the Chat view (⌃⌘I (Windows, Linux Ctrl+Alt+I)), enter the /setupTests command, and Copilot will guide you through the process of configuring your project.
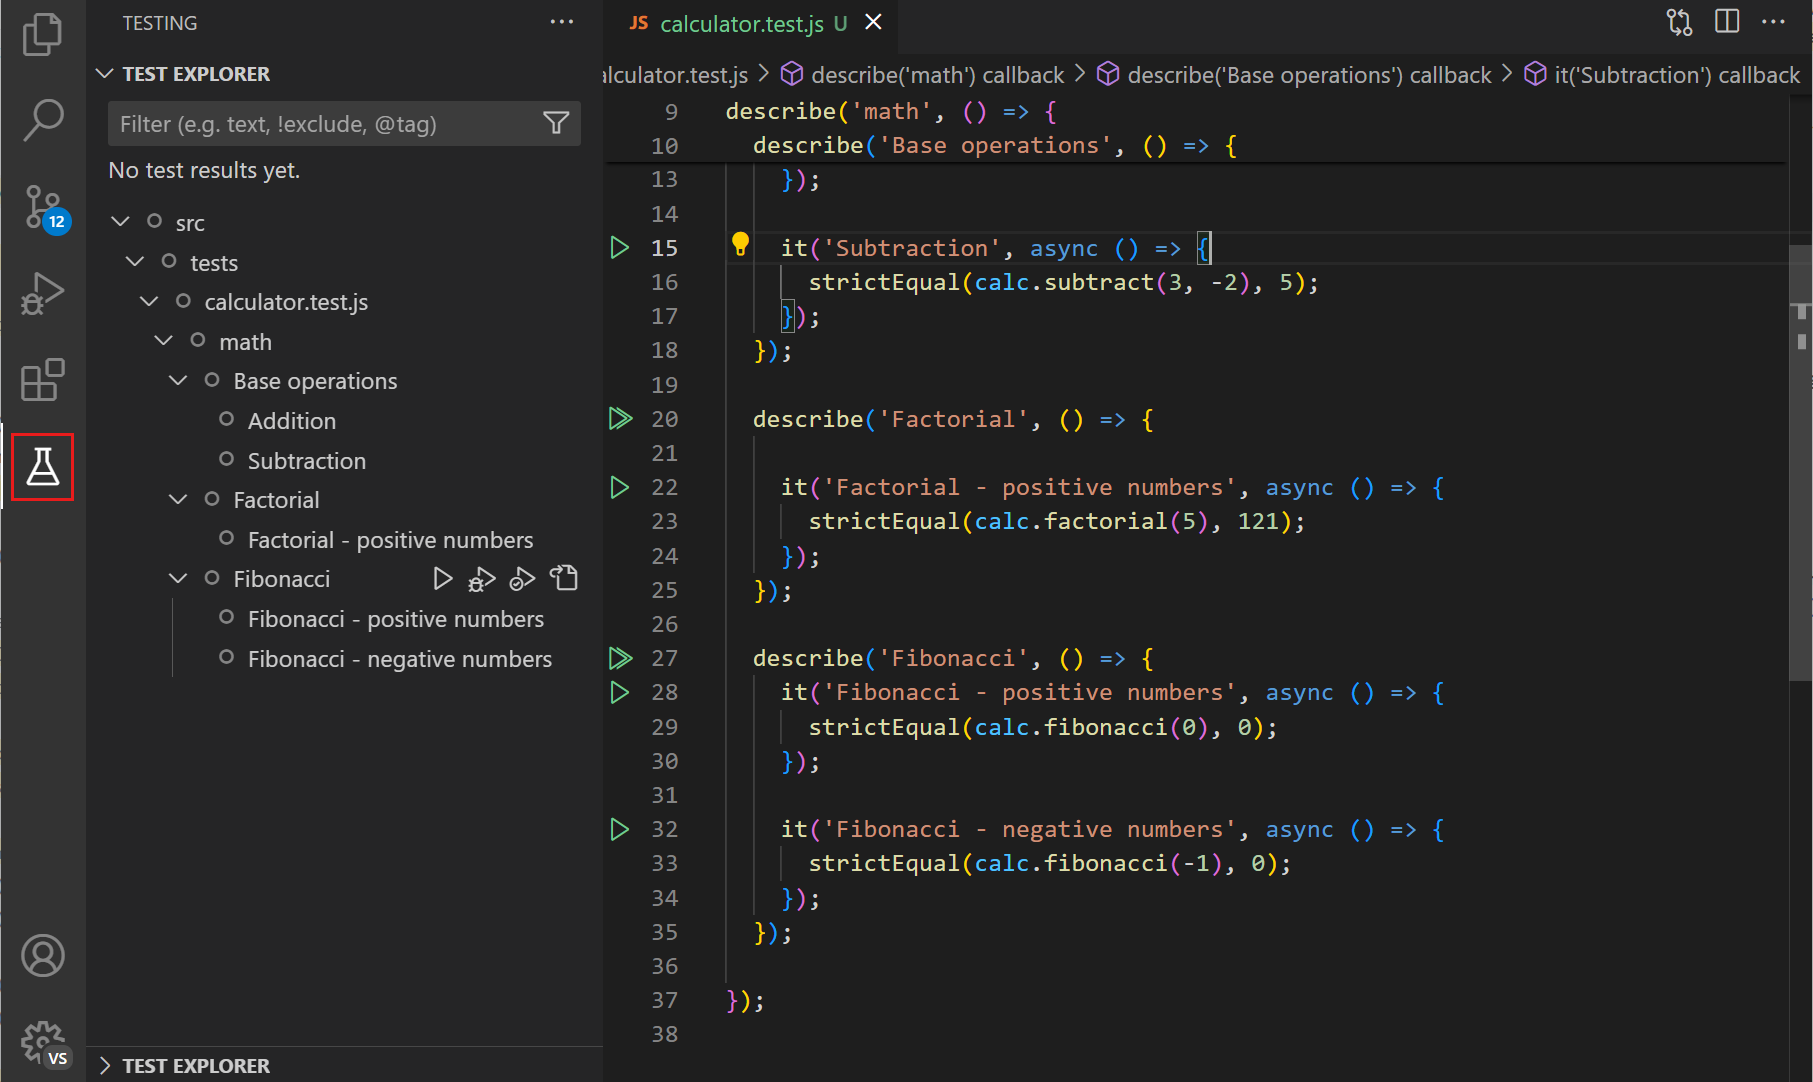
Automatic test discovery in Testing view
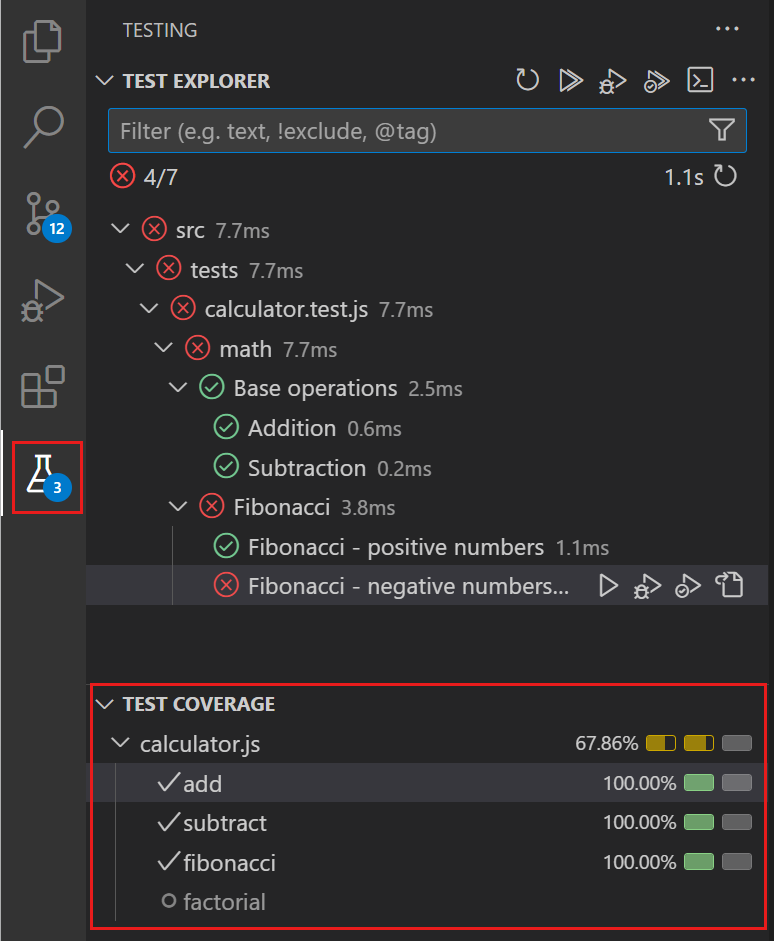
The Testing view provides a centralized place to manage and run your tests. You can get to the Testing view by selecting the beaker icon () in the Activity Bar. You can also use the Testing: Focus on Test Explorer View command in the Command Palette (⇧⌘P (Windows, Linux Ctrl+Shift+P)).
If you have a project with tests, the Test Explorer view discovers and lists the tests in your workspace. By default, the discovered tests are displayed in a tree view in the Test Explorer. The tree view matches the hierarchical structure of your tests, making it easy to navigate and run your tests.
You can run tests from the Test Explorer by selecting the play button. Learn more about running and debugging tests in the Run and debug tests section.
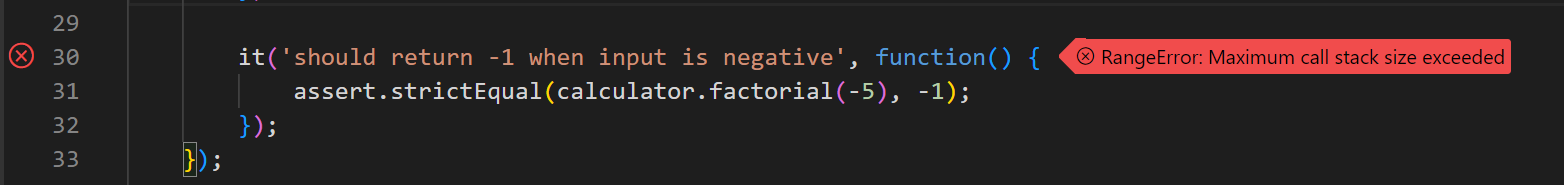
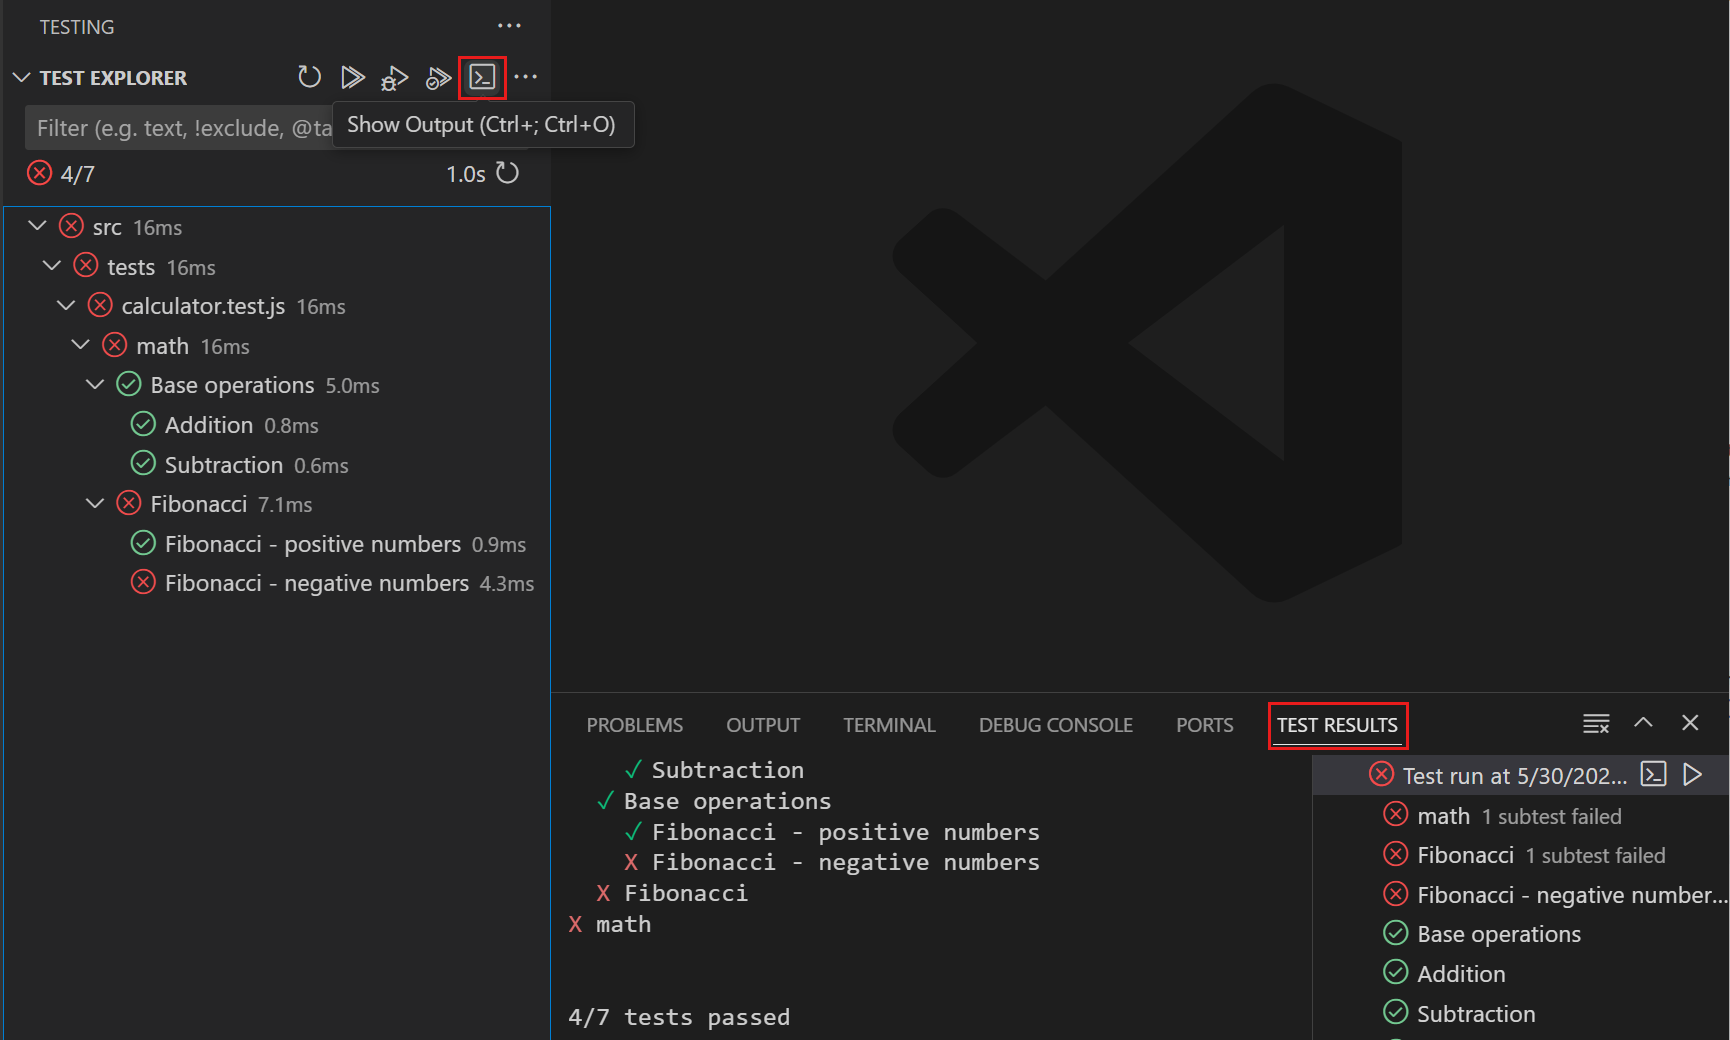
Navigate to the test code by double-clicking on the test in the Test Explorer view. If you select a test that failed, the editor opens the test file, highlights the failed test, and shows the error message.
If you have many tests, you can use the filtering options to quickly find the tests you're interested in. You can use the Filter button to filter tests by status or only show tests for the current file. You can also use the search box to search for specific tests by name or use the @ symbol to search by status.
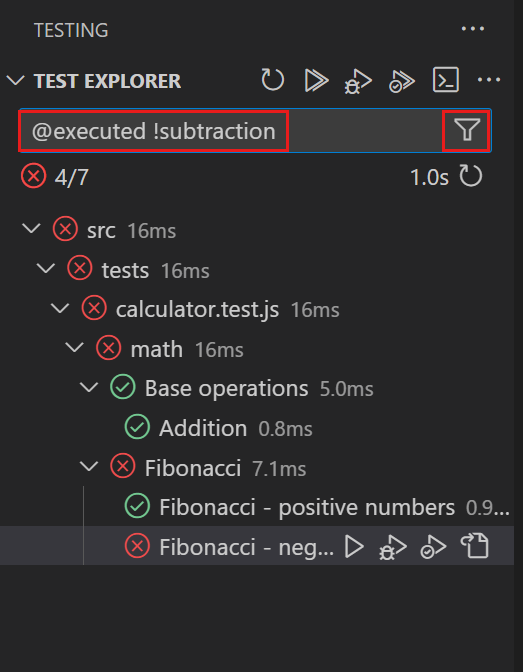
In the More Actions menu, you can access more functionality, such as sort and display options.
If you add new tests or change your tests, use the Refresh Tests button to refresh the list of tests in the Test Explorer. You can also use the Test Explorer: Reload tests command in the Command Palette (⇧⌘P (Windows, Linux Ctrl+Shift+P)).
Depending on the testing extension, you might first have to configure the test framework or test runner to discover the tests in your project. For more information, consult the documentation of the testing extension. You can use the setupTests command in Copilot Chat view to get help with setting up a testing framework for your project.
Write tests with AI
Writing tests can be time-consuming and they're often neglected. Copilot can speed up the process of writing tests by creating test code for your application. You can use it to write unit tests, integration tests, end-to-end tests, and more.
To write tests with Copilot in VS Code, you can use either of these methods:
-
Editor smart actions
-
Optionally, select a block of application code
-
Right-click in the editor, and then select Copilot > Generate Tests
-
-
Chat prompts
-
Open the application code file for which you want to generate tests
-
Open the Copilot Edits (), the Chat view (⌃⌘I (Windows, Linux Ctrl+Alt+I)), or the editor Inline Chat (⌘I (Windows, Linux Ctrl+I))
-
Enter a prompt to generate tests, such as Generate tests for this code. Also include tests for edge cases.
Add extra context to your prompt by typing
#filein the prompt. For example, Generate tests for this code #file:calculator.jsTipGet more example prompts for generating unit tests, mock objects, or end-to-end tests in the GitHub Copilot documentation.
-
Copilot will generate test cases code for your application code. If you already have a tests file, Copilot will add the tests there, or create a new file, if needed. You can further customize the generated tests by providing more prompts to Copilot. For example, you can ask Copilot to use another testing framework.
You can give Copilot your own special instructions for generating code. For example, you can tell Copilot to use a certain testing framework, naming convention, or code structure.
Learn more about using Copilot in VS Code.
Run and debug tests
After the discovery of the tests in your project, you can run and debug your tests, and view test results directly from within VS Code.
In the Test Explorer, use the controls in the section heading to run or debug all tests. You can also run or debug specific tests in the tree view by selecting the run/debug icon on a specific node.
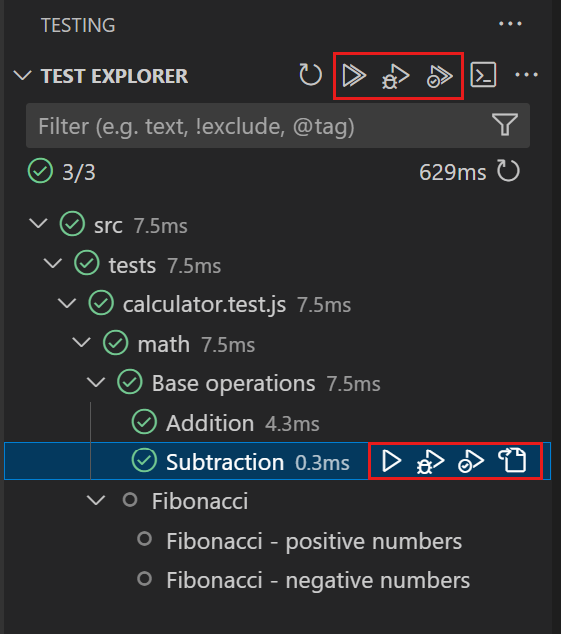
As you're viewing the test code in the editor, use the play control in the editor gutter to run the test at that position.
Right-click on the gutter control to view other actions, such as debugging the test.
Configure the default testing action for the gutter control by using the testing.defaultGutterClickAction setting.
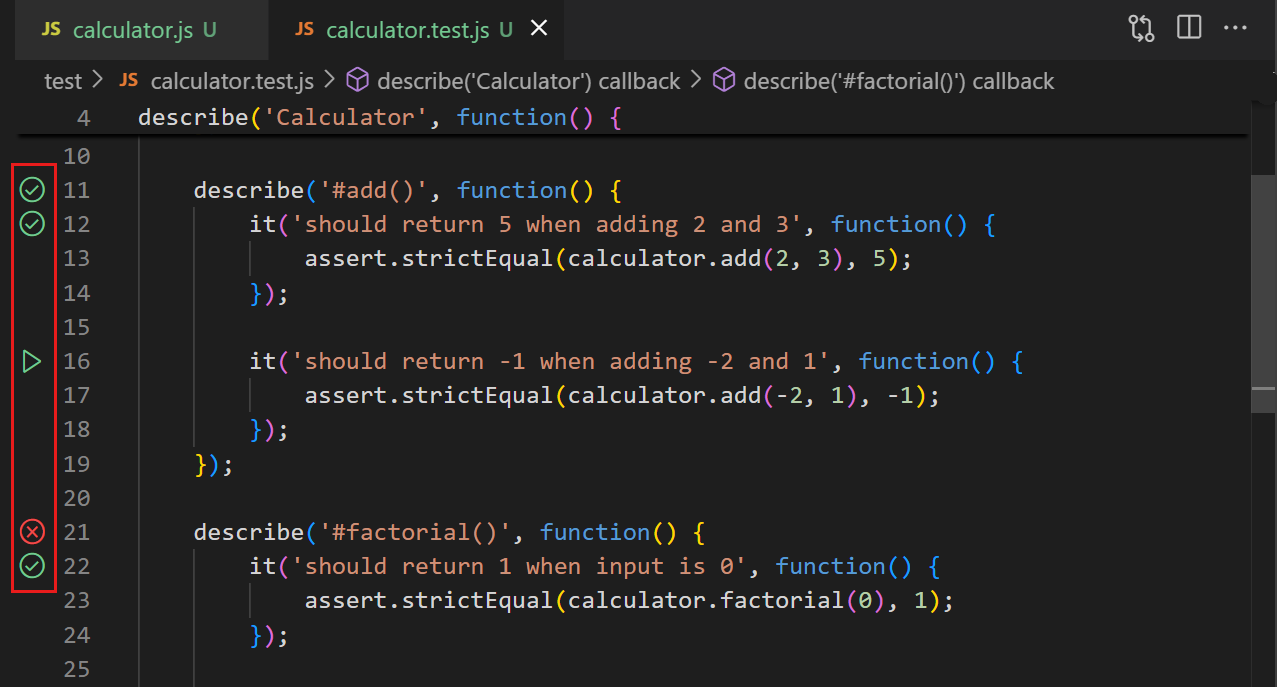
After you run one or more tests, the editor gutter and tree view in the Test Explorer display the corresponding test status (passed/failed). When a test fails, notice that the test error message is shown as an overlay in the editor.
Use the Show Output button in the Test Explorer to view the test output in the Test Results panel.
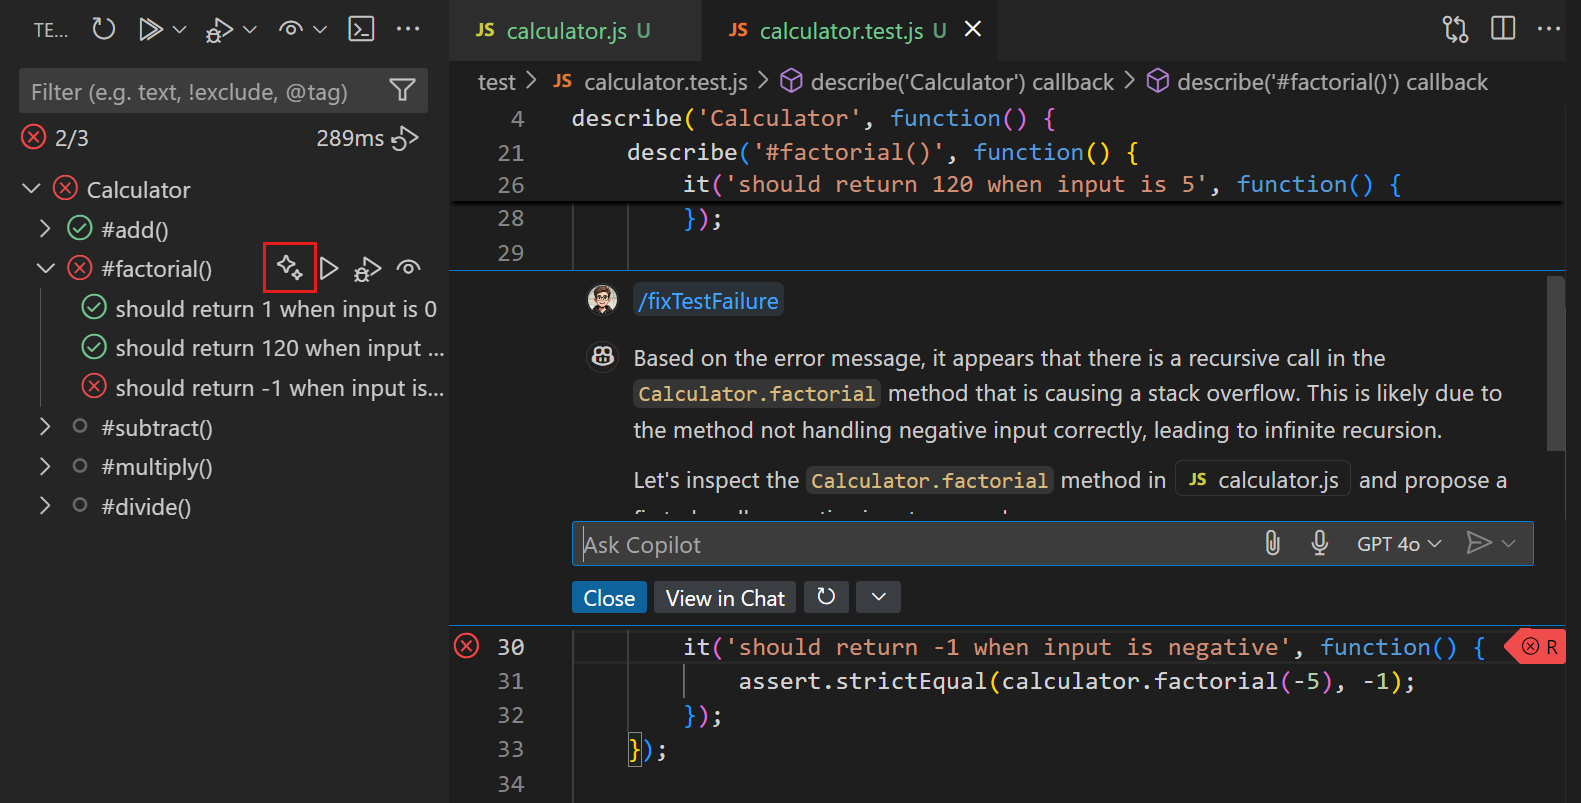
Copilot can help you fix failing tests. In the Test Explorer, hover over the tree view, and select the Fix Test Failure button (sparkle) and Copilot will suggest a fix for the failing test. Alternatively, enter the /fixTestFailure command in Copilot Chat.
Test coverage
Test coverage is a measure of how much of your code is covered by your tests. It helps you identify areas of your code that are not being tested. VS Code supports running tests with coverage and viewing the coverage results if the corresponding testing extension support test coverage.
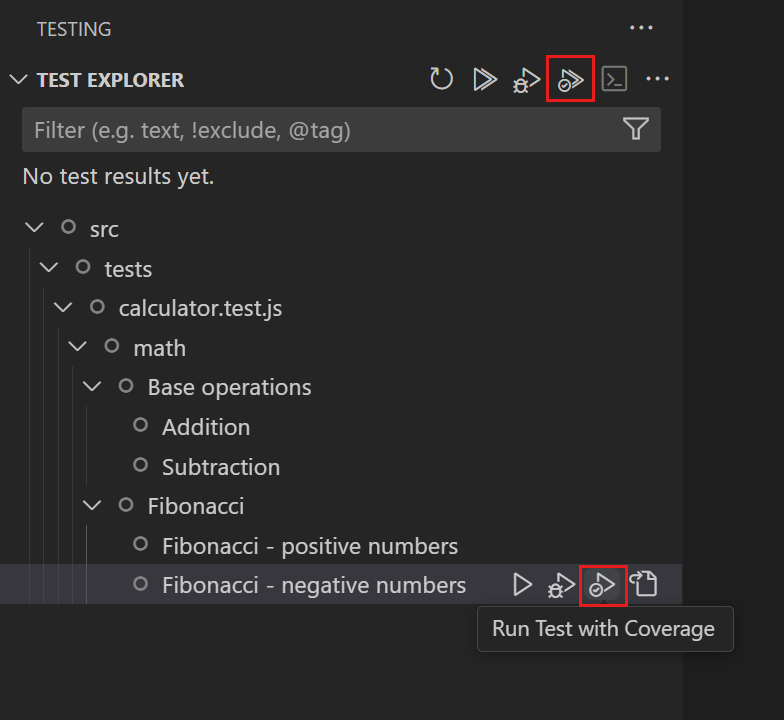
You can run tests with coverage, just like you can run and debug tests. Use corresponding the actions in the Test Explorer view, editor gutter, or commands in the Command Palette (⇧⌘P (Windows, Linux Ctrl+Shift+P)).
After you run tests with coverage, you can view the coverage results in different locations:
-
In the Test Coverage view
A tree view shows the tests with their coverage percentage. A color indicator also gives a visual cue about the coverage percentage. Hover over each line to see more details about the coverage results.
-
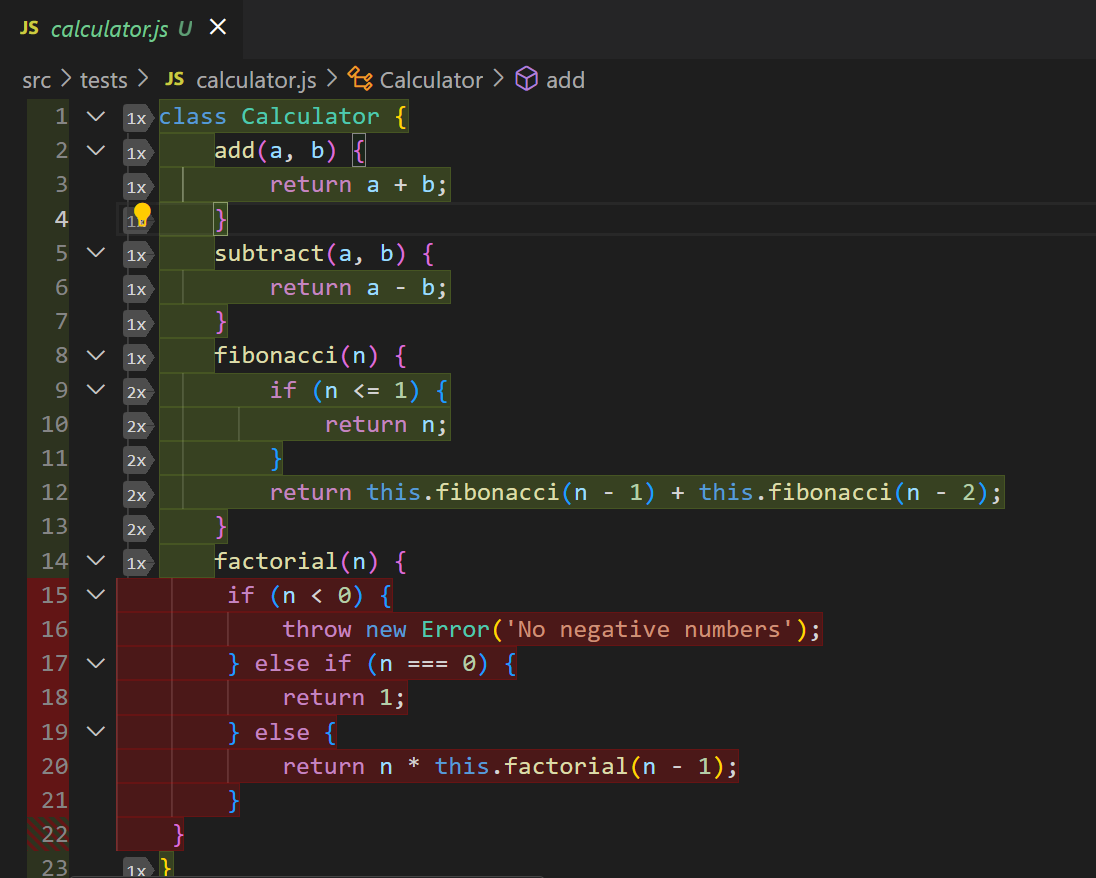
As an overlay in the editor
For code files that have test coverage, the editor shows a color overlay in the gutter to indicate which lines are covered by tests or not. When you hover over the gutter, notice that for covered lines, there is also an indicator for the number of times the line was executed. You can also select the Show Inline Coverage button in the editor title bar or use the Test: Show Inline Coverage command (⌘; ⇧⌘I (Windows, Linux Ctrl+; Ctrl+Shift+I)) to toggle the coverage overlay.
-
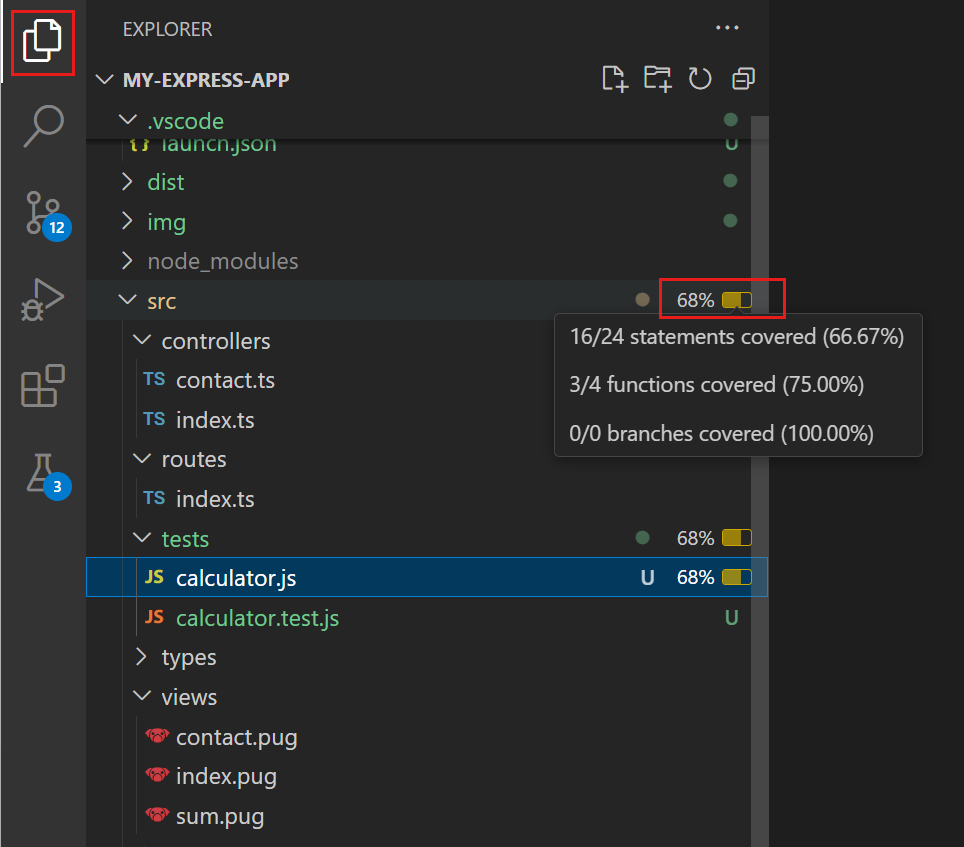
In the Explorer view, which shows the coverage percentage of your code files
The Explorer view shows the coverage percentage of your code files. Hover over a file or node in the Explorer to see more details about the coverage results.
-
In the diff editor
If you have a diff editor open, the coverage results are also shown in the diff editor, similar to how they're shown in the editor.
-
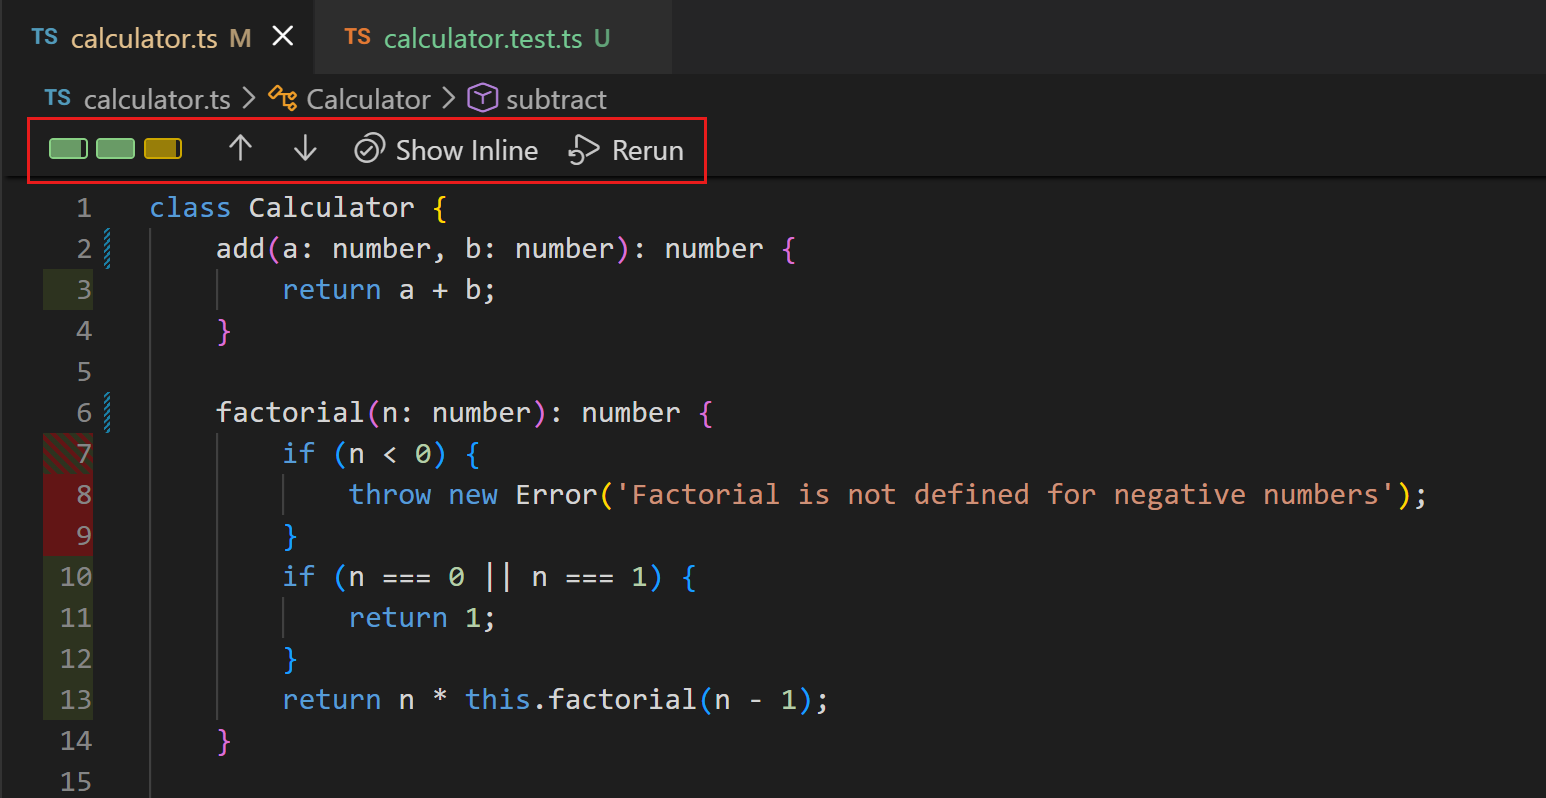
In the Test Coverage toolbar
The Test Coverage toolbar in the editor shows the test coverage results, lets you navigate between uncovered code blocks, and toggle inline coverage. Enable the Test Coverage toolbar with the testing.coverageToolbarEnabled setting.
Task integration
Tasks in VS Code can be configured to run scripts and start processes within VS Code, without having to enter a command line or write new code. In VS Code, you can define a default test task that runs your tests, and optionally create keyboard shortcuts to run the tests.
Use the command Tasks: Configure Default Test Task to configure the default test task. VS Code tries to automatically detect the test task, for example based on your package.json file. After you select the default test task, the tasks.json file is opened for you to customize the task.
The following code snippet shows a tasks.json file that specifies the node --test command as the default test task.
{
  "version": "2.0.0",
  "tasks": [
    {
      "type": "npm",
      "script": "test",
      "group": {
        "kind": "test",
        "isDefault": true
      },
      "problemMatcher": [],
      "label": "npm: test",
      "detail": "node --test src/tests/**.js"
    }
  ]
}
To run the test task, use the command Tasks: Run Test Task or create a keyboard shortcut for the command.
Learn more about using and configuring Tasks.
Currently, tasks don't have special integration into VS Code's testing functionality, so running tests in a task won't update the user interface. Individual testing extensions can provide specific test automation functionality that integrates in the UI.
Test configuration settings
There are multiple settings that you can configure to customize the testing experience in VS Code. Each language extension might provide additional settings specific to testing in that language. Here are some common settings that you can configure:
| Setting ID | Details |
|---|---|
| testing.countBadge | Controls the count badge on the Testing icon on the Activity Bar |
| testing.gutterEnabled | Configure whether to show the test control in the editor gutter |
| testing.defaultGutterClickAction | Configure the default action when selecting the gutter test control |
| testing.coverageBarThresholds | Configure the colors for the coverage bar thresholds for the Test Coverage view |
| testing.displayedCoveragePercent | Configure what percentage value is displayed in the Test Coverage view (total, statement, or minimum) |
| testing.showCoverageInExplorer | Configure whether to show the coverage percentage in the Explorer view |
You can find all testing-related settings in the Settings editor (⌘, (Windows, Linux Ctrl+,)).
Next steps
-
Learn more about Copilot and AI-assisted testing in VS Code
-
Learn more about using and configuring Tasks