Debug code with Visual Studio Code
Visual Studio Code has rich support for debugging various types of applications. VS Code has built-in support for JavaScript, TypeScript, and Node.js debugging. The Visual Studio Marketplace has a wide variety of debugging extensions to add debugging support for other languages and runtimes to VS Code.
This article describes the debugging features of VS Code and how to get started with debugging in VS Code. You also learn how you can use Copilot in VS Code to accelerate setting up your debugging configuration and starting a debugging session.
The following video shows how to get started with debugging in VS Code.
Debugger user interface
The following diagram shows the main components of the debugger user interface:
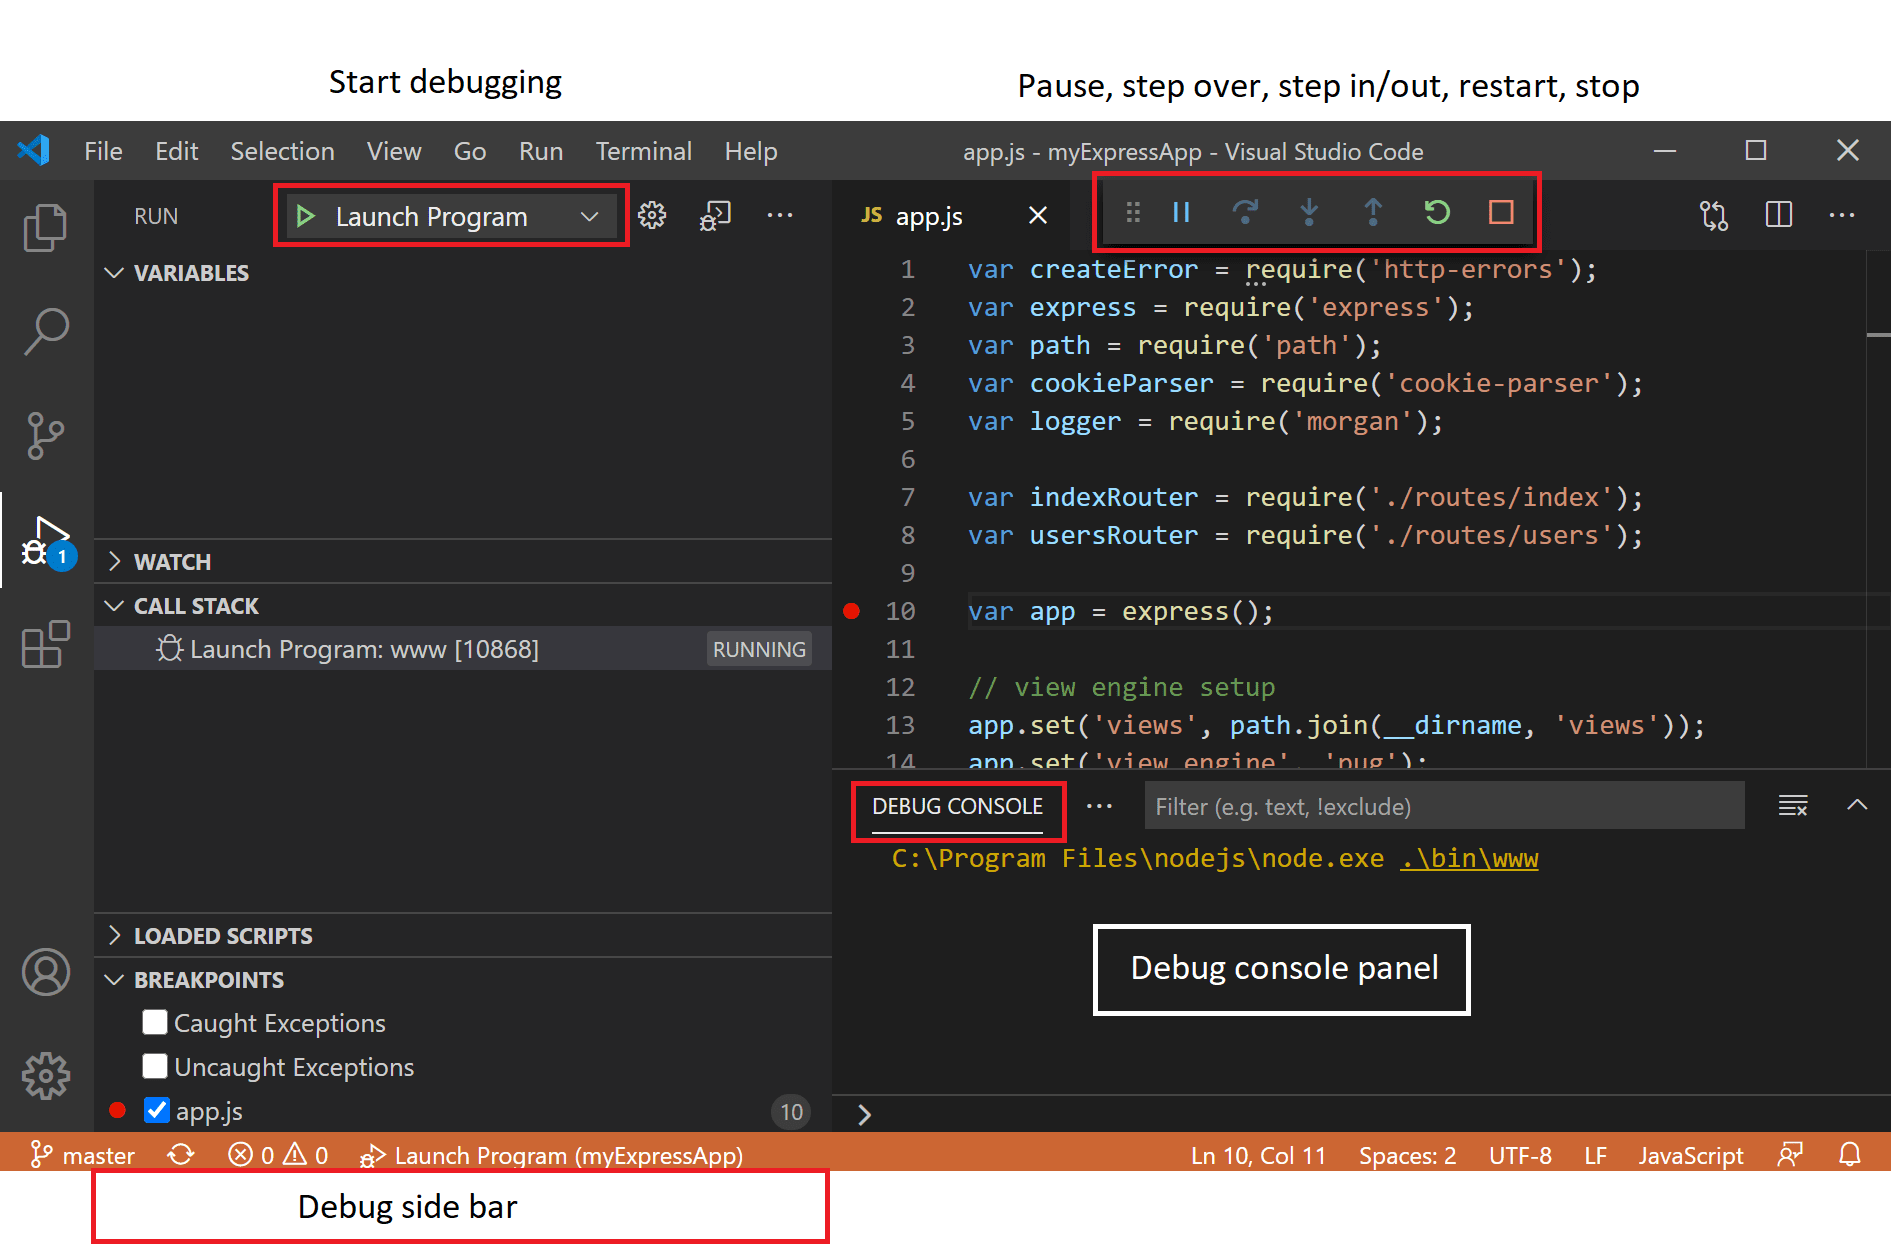
- Run and Debug view: displays all information related to running, debugging, and managing debug configuration settings.
- Debug toolbar: has buttons for the most common debugging actions.
- Debug console: enables viewing and interacting with the output of your code running in the debugger.
- Debug sidebar: during a debug session, lets you interact with the call stack, breakpoints, variables, and watch variables.
- Run menu: has the most common run and debug commands.
Before you start debugging
-
Install a debugging extension from the Visual Studio Marketplace for your language or runtime.
VS Code has built-in support for JavaScript, TypeScript, and Node.js debugging.
-
Define a debugging configuration for your project.
For simple applications, VS Code tries to run and debug the currently active file. For more complex applications or debugging scenarios, you need to create a
launch.jsonfile to specify the debugger configuration. Get more information about creating a debug configuration.TipCopilot in VS Code can help generate the
launch.jsonfile for you. For more information, see Use Copilot to generate debugging configurations. -
Set breakpoints in your code.
A breakpoint is a marker that you can set on a line of code to tell the debugger to pause execution when it reaches that line. You can set breakpoints by clicking in the gutter next to the line number in the editor.
For more information about breakpoints, see Working with Breakpoints.
Start a debugging session
To start a debugging session in VS Code, perform the following steps:
-
Open the file that contains the code you want to debug.
-
Start a debugging session with the F5 key or select Run and Debug in the Run and Debug view (
workbench.view.debug).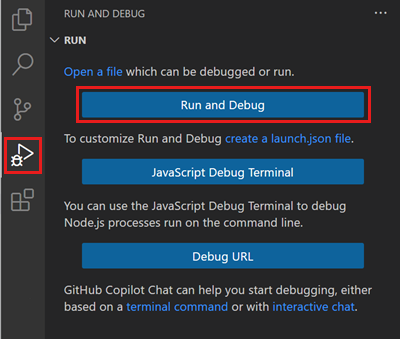
For more complex debugging scenarios like attaching to a running process, you need to create a
launch.jsonfile to specify the debugger configuration. Get more information about debug configurations. -
Choose the debugger you want to use from the list of available debuggers.
VS Code tries to run and debug the currently active file. For Node.js, VS Code checks for a
startscript in thepackage.jsonfile to determine the entry point of the application. -
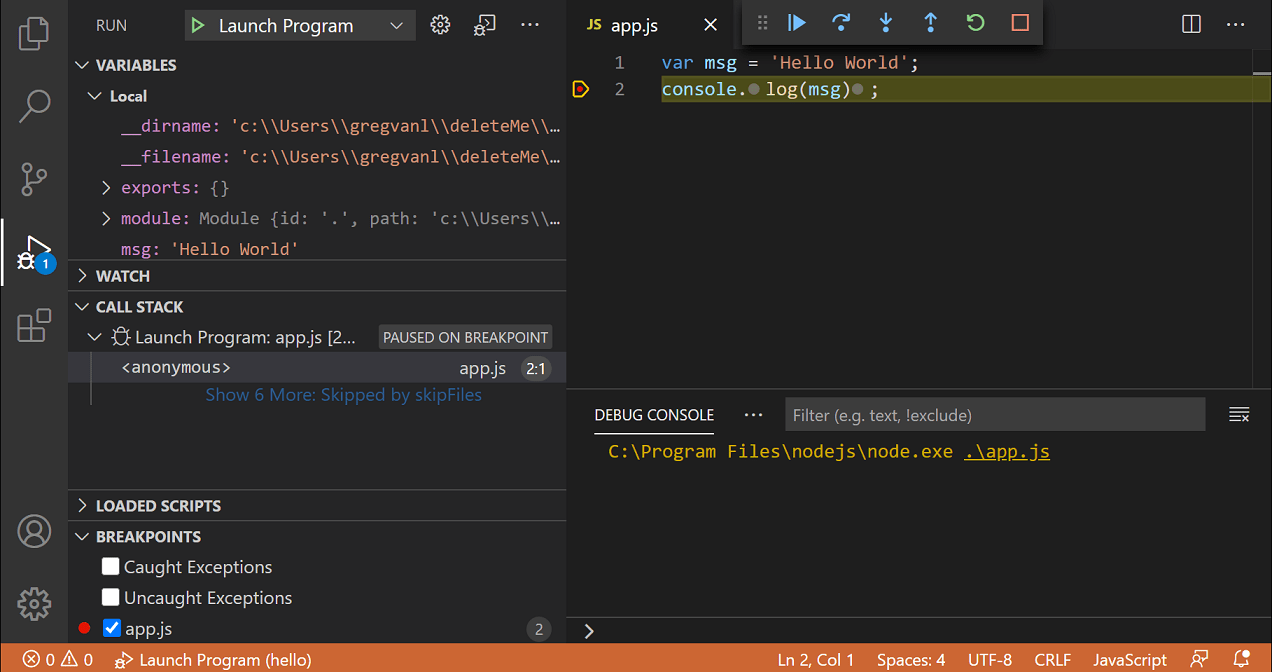
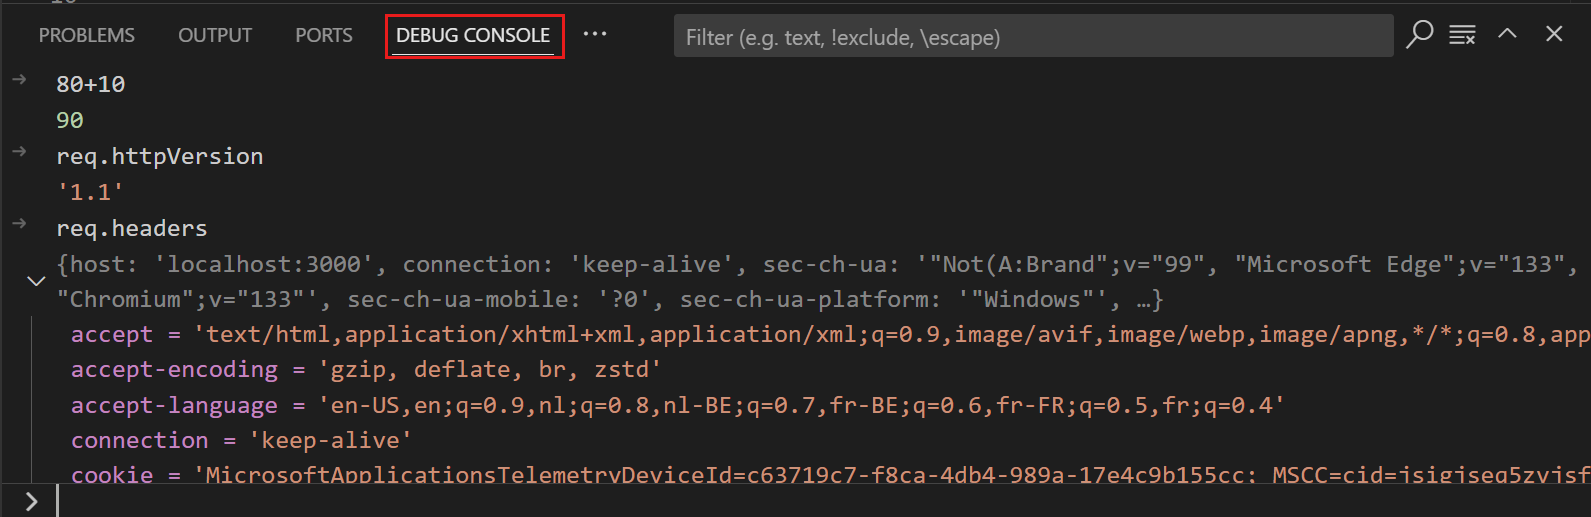
When a debugging session starts, the DEBUG CONSOLE panel is displayed and shows debugging output, and the Status Bar changes color (orange for default color themes).
-
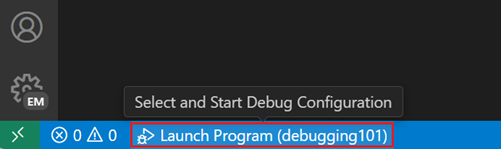
The debug status in the Status Bar shows the active debug configuration. Select the debug status to change the active launch configuration and start debugging without needing to open the Run and Debug view.
Debug actions
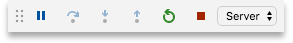
Once a debug session starts, the Debug toolbar appears at the top of the window. The toolbar contains actions to control the flow of the debug session, such as stepping through code, pausing execution, and stopping the debug session.
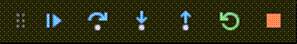
The following table describes the actions available in the debug toolbar:
| Action | Description |
|---|---|
| Continue / Pause F5 |
Continue: Resume normal program/script execution (up to the next breakpoint). Pause: Inspect code executing at the current line and debug line-by-line. |
| Step Over F10 |
Execute the next method as a single command without inspecting or following its component steps. |
| Step Into F11 |
Enter the next method to follow its execution line-by-line. |
| Step Out ⇧F11 (Windows, Linux Shift+F11) |
When inside a method or subroutine, return to the earlier execution context by completing remaining lines of the current method as though it were a single command. |
| Restart ⇧⌘F5 (Windows, Linux Ctrl+Shift+F5) |
Terminate the current program execution and start debugging again using the current run configuration. |
| Stop ⇧F5 (Windows, Linux Shift+F5) |
Terminate the current program execution. |
If your debugging sessions involve multiple targets (for example, a client and a server), the debug toolbar shows the list of sessions and lets you switch between them.
Use the
debug.toolBarLocation
setting to control the location of the Debug toolbar. It can be the default floating, docked to the Run and Debug view, or hidden. A floating debug toolbar can be dragged horizontally and also down to the editor area (up to a certain distance from the top edge).
Breakpoints
A breakpoint is a special marker that pauses the execution of your code at a specific point, so you can inspect the state of your application at that point. VS Code supports several types of breakpoints.
Setting breakpoints
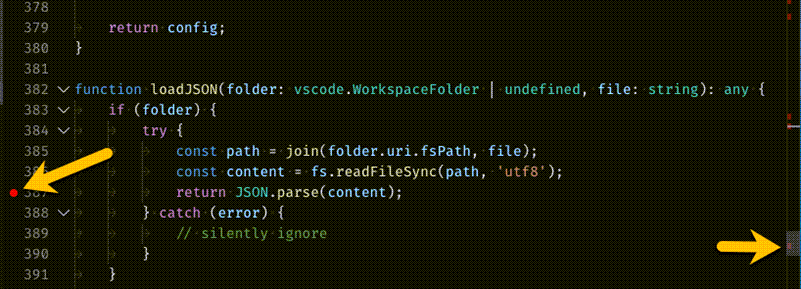
To set or unset a breakpoint, click on the editor margin or use F9 on the current line.
- Breakpoints in the editor margin are normally shown as red filled circles.
- Disabled breakpoints have a filled gray circle.
- When a debugging session starts, breakpoints that can't be registered with the debugger change to a gray hollow circle. The same might happen if the source is edited while a debug session without live-edit support is running.
Optionally, breakpoints can be shown in the editor's overview ruler by enabling the setting debug.showBreakpointsInOverviewRuler :
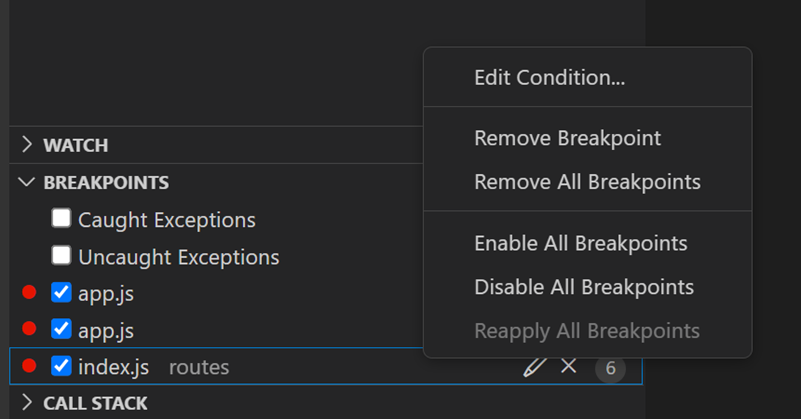
For more control of your breakpoints, use the Run and Debug view's BREAKPOINTS section. This section lists all breakpoints in your code and provides extra actions to manage them.
If you prefer to see the breakpoints in a tree view, grouped by file, configure the
debug.breakpointsView.presentation
setting to tree.
Breakpoint types
Conditional breakpoints
A powerful VS Code debugging feature is the ability to set conditions based on expressions, hit counts, or a combination of both.
- Expression condition: The breakpoint is hit whenever the expression evaluates to
true. - Hit count: The hit count controls how many times a breakpoint needs to be hit before it interrupts execution. Whether a hit count is respected, and the exact syntax of the expression, can vary among debugger extensions.
- Wait for breakpoint: The breakpoint is activated when another breakpoint is hit (triggered breakpoint).
To add a conditional breakpoint:
-
Create a conditional breakpoint
- Right-click in the editor margin and select Add Conditional Breakpoint.
- Use the Add Conditional Breakpoint command in the Command Palette (⇧⌘P (Windows, Linux Ctrl+Shift+P)).
-
Choose the type of condition you want to set (expression, hit count, or wait for breakpoint).
To add a condition to an existing breakpoint:
-
Edit an existing breakpoint
- Right-click on the breakpoint in the editor margin and select Edit Breakpoint.
- Select the pencil icon next for an existing breakpoint in the BREAKPOINTS section of the Run and Debug view.
-
Edit the condition (expression, hit count, or wait for breakpoint).
If a debugger does not support conditional breakpoints, the Add Conditional Breakpoint and Edit Condition actions are not available.
Triggered breakpoints
A triggered breakpoint is type of conditional breakpoint that is enabled once another breakpoint is hit. They can be useful when diagnosing failure cases in code that happen only after a certain precondition.
Triggered breakpoints can be set by right-clicking on the glyph margin, selecting Add Triggered Breakpoint, and then choosing which other breakpoint enables the breakpoint.
Inline breakpoints
Inline breakpoints are only hit when the execution reaches the column associated with the inline breakpoint. This is useful when debugging minified code, which contains multiple statements in a single line.
An inline breakpoint can be set using ⇧F9 (Windows, Linux Shift+F9) or through the context menu during a debug session. Inline breakpoints are shown inline in the editor.
Inline breakpoints can also have conditions. Editing multiple breakpoints on a line is possible through the context menu in the editor's left margin.
Function breakpoints
Instead of placing breakpoints directly in source code, a debugger can support creating breakpoints by specifying a function name. This is useful in situations where source is not available but a function name is known.
To create a function breakpoint, select the + button in the BREAKPOINTS section header and enter the function name. Function breakpoints are shown with a red triangle in the BREAKPOINTS section.
Data breakpoints
If a debugger supports data breakpoints, they can be set from the context menu in the VARIABLES view. The Break on Value Change/Read/Access commands add a data breakpoint that is hit when the value of the underlying variable changes/is read/is accessed. Data breakpoints are shown with a red hexagon in the BREAKPOINTS section.
Logpoints
A logpoint is a variant of a breakpoint that does not interrupt into the debugger, but instead logs a message to the debug console. Logpoints can help you save time by not having to add or remove logging statements in your code.
A logpoint is represented by a diamond-shaped icon. Log messages are plain text but can also include expressions to be evaluated within curly braces ('{}').
To add a logpoint, right-click in the editor left margin and select Add Logpoint, or use the Debug: Add Logpoint... command in the Command Palette (⇧⌘P (Windows, Linux Ctrl+Shift+P)). You can also configure the setting debug.gutterMiddleClickAction to toggle a logpoint when pressing the middle mouse button in the editor gutter.
Just like regular breakpoints, logpoints can be enabled or disabled and can also be controlled by a condition and/or hit count.
Debugger extensions can choose to implement logpoints or not.
Data inspection
Run and Debug view
During a debugging session, you can inspect variables and expressions in the VARIABLES section of the Run and Debug view or by hovering over their source in the editor. Variable values and expression evaluation are relative to the selected stack frame in the CALL STACK section.
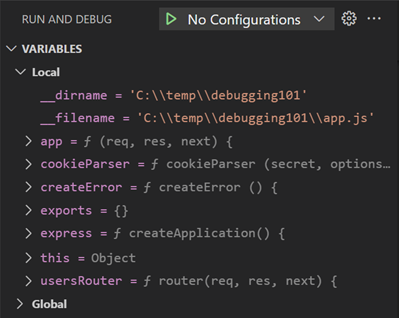
To change the value of a variable during the debugging session, right-click on the variable in the VARIABLES section and select Set Value (Enter (Windows, Linux F2)).
Additionally, you can use the Copy Value action to copy the variable's value, or the Copy as Expression action to copy an expression to access the variable. You can then use this expression in the WATCH section.
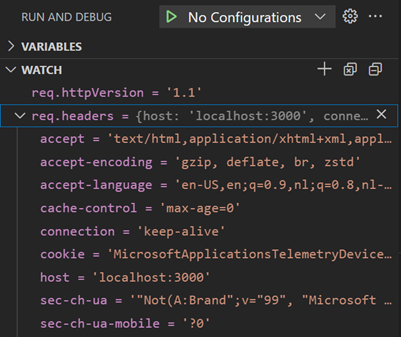
Variables and expressions can also be evaluated and watched in the Run and Debug view's WATCH section.
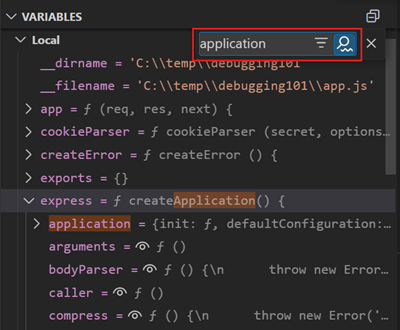
To filter variables by their name or value, use the ⌥⌘F (Windows, Linux Ctrl+Alt+F) keyboard shortcut while the focus is on the VARIABLES section, and type a search term.
Debug console REPL
Expressions can be evaluated with the Debug Console REPL (Read-Eval-Print Loop) feature. To open the Debug Console, use the Debug Console action at the top of the Debug pane or use the View: Debug Console command (⇧⌘Y (Windows, Linux Ctrl+Shift+Y)).
Expressions are evaluated after you press Enter and the Debug Console REPL shows suggestions as you type. If you need to enter multiple lines, use Shift+Enter between the lines and then send all lines for evaluation with Enter.
Debug Console input uses the mode of the active editor, which means that the Debug Console input supports syntax coloring, indentation, auto closing of quotes, and other language features.
You must be in an active debugging session to use the Debug Console REPL.
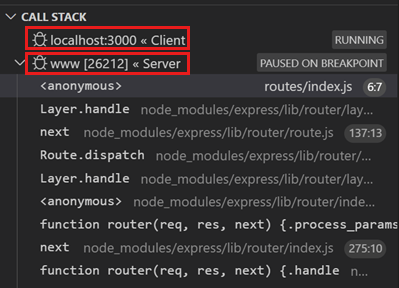
Multi-target debugging
For complex scenarios that involve more than one process (for example, a client and a server), VS Code supports multi-target debugging. After you've started a first debug session, you can launch another debug session. As soon as a second session is up and running, the VS Code UI switches to multi-target mode:
-
The individual sessions now show up as top-level elements in the CALL STACK view.
-
The debug toolbar shows the currently active session (and all other sessions are available in a dropdown menu).
-
Debug actions (for example, all actions in the debug toolbar) are performed on the active session. The active session can be changed either by using the dropdown menu in the debug toolbar or by selecting a different element in the CALL STACK view.
Remote debugging
VS Code does not support built-in remote debugging across all languages. Remote debugging is a feature of the debug extension you are using, and you should consult the extension's page in the Marketplace for support and details.
There is, however, one exception: the Node.js debugger included in VS Code supports remote debugging. For more information, see Node.js Debugging.
Debugger extensions
VS Code has built-in debugging support for the Node.js runtime and can debug JavaScript, TypeScript, or any other language that gets transpiled to JavaScript.
For debugging other languages and runtimes (including PHP, Ruby, Go, C#, Python, C++, PowerShell and many others), look for Debuggers extensions in the Visual Studio Marketplace, or select Install Additional Debuggers in the top-level Run menu.
These are several popular extensions that include debugging support:
Next steps
To learn about VS Code's Node.js debugging support, take a look at:
- Node.js - Describes the Node.js debugger, which is included in VS Code.
- TypeScript - The Node.js debugger also supports TypeScript debugging.
To see a tutorial on the basics of debugging, check out this video:
- Getting started with debugging in VS Code - Learn about debugging in VS Code.
To learn more about Copilot and AI-assisted debugging in VS Code:
To learn about debugging support for other programming languages via VS Code extensions:
To learn about VS Code's task running support, go to:
- Tasks - Describes how to run tasks with Gulp, Grunt, and Jake and how to show errors and warnings.
To write your own debugger extension, visit:
- Debugger Extension - Uses a mock sample to illustrate the steps required to create a VS Code debug extension.
Common questions
What are the supported debugging scenarios?
Debugging of Node.js-based applications is supported on Linux, macOS, and Windows out of the box with VS Code. Many other scenarios are supported by VS Code extensions available in the Marketplace.