Visual Studio Code debug configuration
For complex debugging scenarios or applications, you need to create a launch.json file to specify the debugger configuration. For example, to specify the application entry point, attach to a running application, or to set environment variables.
To learn more about debugging in VS Code, see Debugging in Visual Studio Code.
Copilot in VS Code can help you create a launch configuration for your project. Get more info about generating a launch configuration with Copilot.
Launch configurations
For simple applications or debugging scenarios, you can run and debug a program without specific debugging configurations. Use the F5 key and VS Code will try to run your currently active file.
However, for most debugging scenarios you need to create a debugging configuration (launch configuration). For example, to specify the application entry point, attach to a running application, or set environment variables. Creating a launch configuration file is also beneficial because it allows you to configure and save debugging setup details with your project.
VS Code stores debugging configuration information in a launch.json file located in the .vscode folder in your workspace (project root folder), or in your user settings or workspace settings.
The following snippet describes a sample configuration for debugging a Node.js application:
{
  "version": "0.2.0",
  "configurations": [
    {
      "type": "node",
      "request": "launch",
      "name": "Launch Program",
      "skipFiles": ["<node_internals>/**"],
      "program": "${workspaceFolder}\\app.js"
    }
  ]
}
VS Code also supports compound launch configurations for starting multiple configurations at the same time.
You can debug a simple application even if you don't have a folder open in VS Code, but it is not possible to manage launch configurations and set up advanced debugging.
Create a debug configuration file
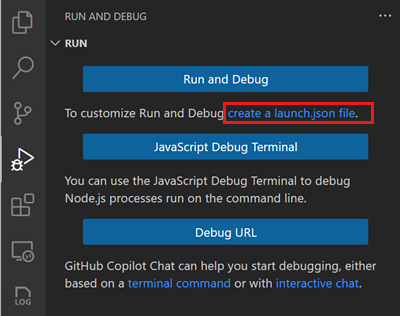
To create an initial launch.json file:
-
Select create a launch.json file in the Run and Debug view.
-
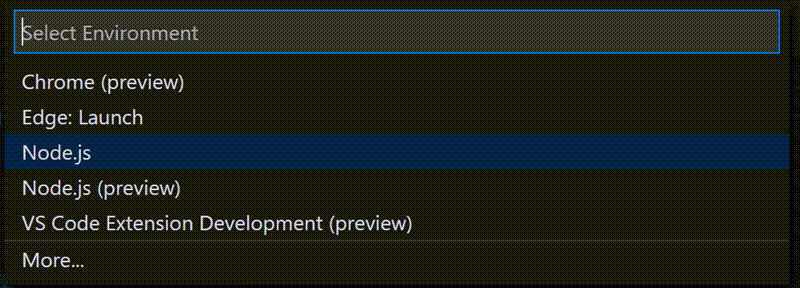
VS Code tries to detect your debug environment. If it's unable to do so, you can choose it manually:
Based on the selected debug environment, VS Code creates a starter configuration in the
launch.jsonfile. -
In the Explorer view (⇧⌘E (Windows, Linux Ctrl+Shift+E)), notice that VS Code created a
.vscodefolder and added thelaunch.jsonfile to your workspace.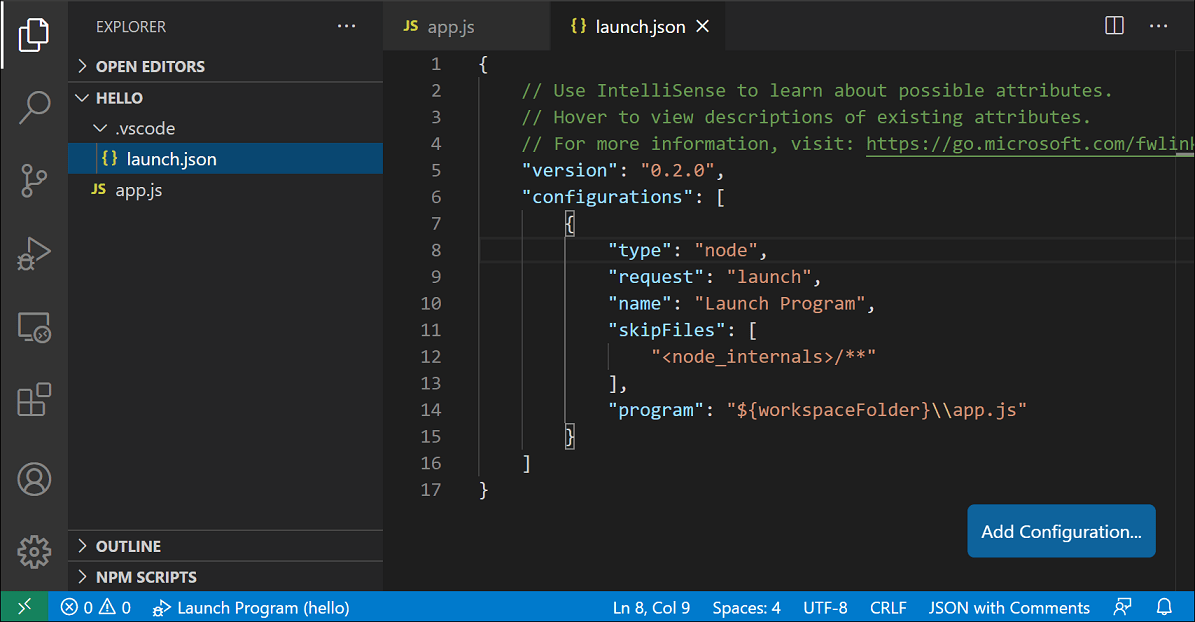
You can now edit the launch.json file to add more configurations or modify existing ones.
Add a configuration to launch.json
To add a new configuration to an existing launch.json, use one of the following techniques:
- Press the Add Configuration button and then select a snippet to add a predefined configuration.
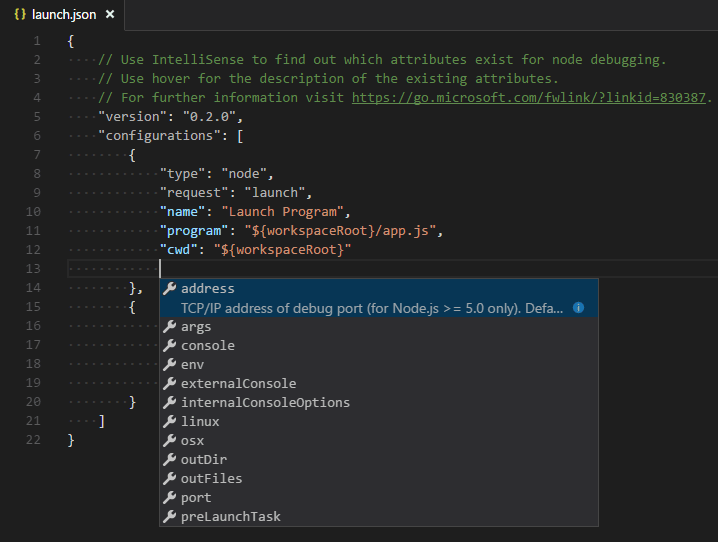
- Use IntelliSense if your cursor is located inside the configurations array.
- Choose the Run > Add Configuration menu option.
Generate a launch configuration with AI
With Copilot in VS Code, you can accelerate the process of creating a launch configuration for your project. To generate a launch configuration with Copilot:
-
Open the Chat view with ⌃⌘I (Windows, Linux Ctrl+Alt+I), or select Open Chat from the Copilot menu in the title bar.
-
Enter the
/startDebuggingchat prompt to generate a debug configuration.Alternatively, you can also enter a custom prompt, like generate a debug config for an express app #codebase.
This can be useful if your workspace has files with different languages.
NoteThe
#codebasechat variable gives Copilot the context of your project, which helps it generate a more accurate response. -
Apply the suggested configuration, and then start debugging.
Start a debugging session with a launch configuration
To start a debug session with a launch configuration:
-
Select the configuration named Launch Program using the Configuration dropdown in the Run and Debug view.
The list of available configurations matches those in the
launch.jsonfile.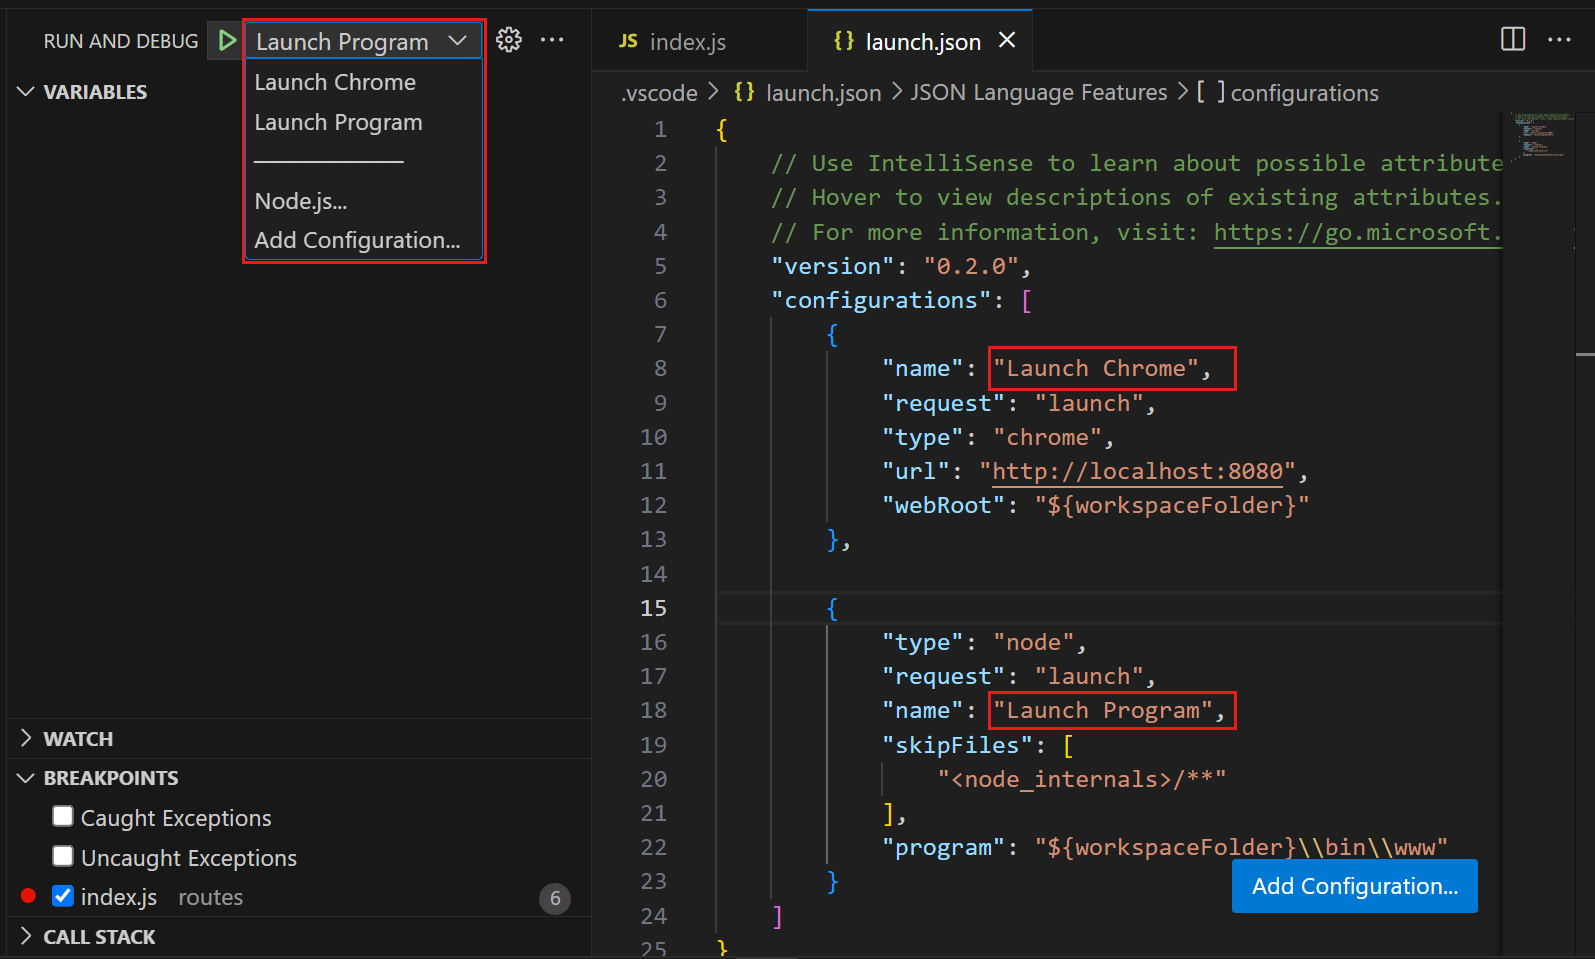
-
Start your debug session with F5 or select Start Debugging (play icon) in Run and Debug view.
Alternatively, you can run your configuration through the Command Palette (⇧⌘P (Windows, Linux Ctrl+Shift+P)) by filtering on Debug: Select and Start Debugging or typing 'debug ' and selecting the configuration you want to debug.
Launch versus attach configurations
In VS Code, there are two core debugging modes, Launch and Attach, which handle two different workflows and segments of developers. Depending on your workflow, it can be confusing to know what type of configuration is appropriate for your project.
If you come from a browser Developer Tools background, you might not be used to "launching from your tool," since your browser instance is already open. When you open DevTools, you are simply attaching DevTools to your open browser tab. On the other hand, if you come from a server or desktop background, it's quite normal to have your editor launch your process for you, and your editor automatically attaches its debugger to the newly launched process.
The best way to explain the difference between launch and attach is to think of a launch configuration as a recipe for how to start your app in debug mode before VS Code attaches to it, while an attach configuration is a recipe for how to connect VS Code's debugger to an app or process that's already running.
VS Code debuggers typically support launching a program in debug mode or attaching to an already running program in debug mode. Depending on the request (attach or launch), different attributes are required, and VS Code's launch.json validation and suggestions should help with that.
Launch.json attributes
There are many launch.json attributes to help support different debuggers and debugging scenarios. You can use IntelliSense (⌃Space (Windows, Linux Ctrl+Space)) to see the list of available attributes once you have specified a value for the type attribute. The attributes available in launch configurations vary from debugger to debugger.
An attribute that is available for one debugger doesn't automatically work for other debuggers too. If you see red squiggles in your launch configuration, hover over them to learn what the problem is and try to fix them before launching a debug session.
The following attributes are mandatory for every launch configuration:
type- the type of debugger to use for this launch configuration. Every installed debug extension introduces a type:nodefor the built-in Node debugger, for example, orphpandgofor the PHP and Go extensions.request- the request type of this launch configuration. Currently, launch andattachare supported.name- the reader-friendly name to appear in the Debug launch configuration dropdown.
Here are some optional attributes available to all launch configurations:
presentation- using theorder,group, andhiddenattributes in thepresentationobject, you can sort, group, and hide configurations and compounds in the Debug configuration dropdown and in the Debug quick pick. You can also setpresentationinside platform-specific sections (windows,linux,osx) to control visibility per operating system.preLaunchTask- to launch a task before the start of a debug session, set this attribute to the label of a task specified in tasks.json (in the workspace's.vscodefolder). Or, this can be set to${defaultBuildTask}to use your default build task.postDebugTask- to launch a task at the very end of a debug session, set this attribute to the name of a task specified in tasks.json (in the workspace's.vscodefolder).internalConsoleOptions- this attribute controls the visibility of the Debug console panel during a debugging session.debugServer- for debug extension authors only: this attribute allows you to connect to a specified port instead of launching the debug adapter.serverReadyAction- if you want to open a URL in a web browser whenever the program under debugging outputs a specific message to the debug console or integrated terminal. For details see section Automatically open a URI when debugging a server program below.
Many debuggers support some of the following attributes:
program- executable or file to run when launching the debuggerargs- arguments passed to the program to debugenv- environment variables (the valuenullcan be used to "undefine" a variable)envFile- path to dotenv file with environment variablescwd- current working directory for finding dependencies and other filesport- port when attaching to a running processstopOnEntry- break immediately when the program launchesconsole- what kind of console to use, for example,internalConsole,integratedTerminal, orexternalTerminal
Variable substitution
VS Code makes commonly used paths and other values available as variables and supports variable substitution inside strings in launch.json. This means that you do not have to use absolute paths in debug configurations. For example, ${workspaceFolder} gives the root path of a workspace folder, ${file} the file open in the active editor, and ${env:Name} the environment variable 'Name'.
You can see a full list of predefined variables in the Variables Reference or by invoking IntelliSense inside the launch.json string attributes.
{
  "type": "node",
  "request": "launch",
  "name": "Launch Program",
  "program": "${workspaceFolder}/app.js",
  "cwd": "${workspaceFolder}",
  "args": ["${env:USERNAME}"]
}
Platform-specific properties
VS Code supports defining debugging configuration settings (for example, arguments to be passed to the program) that depend on the operating system where the debugger is running. To do so, put a platform-specific literal in the launch.json file and specify the corresponding properties inside that literal.
The following example shows how to pass "args" to the program differently on Windows:
{
  "version": "0.2.0",
  "configurations": [
    {
      "type": "node",
      "request": "launch",
      "name": "Launch Program",
      "program": "${workspaceFolder}/node_modules/gulp/bin/gulpfile.js",
      "args": ["myFolder/path/app.js"],
      "windows": {
        "args": ["myFolder\\path\\app.js"]
      }
    }
  ]
}
Valid operating system properties are "windows" for Windows, "linux" for Linux, and "osx" for macOS. Properties defined in an operating system specific scope override properties defined in the global scope.
The type property cannot be placed inside a platform-specific section because type indirectly determines the platform in remote debugging scenarios, which would result in a cyclic dependency.
In the following example, debugging the program always stops on entry, except on macOS:
{
  "version": "0.2.0",
  "configurations": [
    {
      "type": "node",
      "request": "launch",
      "name": "Launch Program",
      "program": "${workspaceFolder}/node_modules/gulp/bin/gulpfile.js",
      "stopOnEntry": true,
      "osx": {
        "stopOnEntry": false
      }
    }
  ]
}
You can also use platform-specific sections to control presentation properties. In the following example, the configuration is hidden from the Debug dropdown on macOS:
{
  "version": "0.2.0",
  "configurations": [
    {
      "type": "node",
      "request": "launch",
      "name": "Launch Program",
      "program": "${workspaceFolder}/app.js",
      "osx": {
        "presentation": {
          "hidden": true
        }
      }
    }
  ]
}
Global launch configuration
You can define launch configurations that are available across all your workspaces. To specify a global launch configuration, add a launch configuration object in your
launch
user setting. This launch configuration is then shared across your workspaces. For example:
"launch": {
    "version": "0.2.0",
    "configurations": [{
        "type": "node",
        "request": "launch",
        "name": "Launch Program",
        "program": "${file}"
    }]
}
Redirect input/output to/from the debug target
Redirecting input/output is debugger or runtime specific, so VS Code does not have a built-in solution that works for all debuggers.
Here are two approaches you might want to consider:
-
Launch the program to debug ("debug target") manually in a terminal or command prompt and redirect input/output as needed. Ensure that you pass the appropriate command line options to the debug target so that a debugger can attach to it. Create and run an "attach" debug configuration that attaches to the debug target.
-
If the debugger extension you are using can run the debug target in VS Code's Integrated Terminal (or an external terminal), you can try to pass the shell redirect syntax (for example, "<" or ">") as arguments.
Here's an example
launch.jsonconfiguration:{ "name": "launch program that reads a file from stdin", "type": "node", "request": "launch", "program": "program.js", "console": "integratedTerminal", "args": ["<", "in.txt"] }This approach requires that the
<syntax is passed through the debugger extension and ends up unmodified in the Integrated Terminal.
Compound launch configurations
An alternative way to start multiple debug sessions is by using a compound launch configuration. You can define compound launch configurations in the compounds property in the launch.json file.
Use the configurations attribute to list the names of two or more launch configurations that should be launched in parallel.
Optionally, specify a preLaunchTask task that is run before the individual debug sessions are started. The boolean flag stopAll controls whether manually terminating one session stops all of the compound sessions.
{
  "version": "0.2.0",
  "configurations": [
    {
      "type": "node",
      "request": "launch",
      "name": "Server",
      "program": "${workspaceFolder}/server.js"
    },
    {
      "type": "node",
      "request": "launch",
      "name": "Client",
      "program": "${workspaceFolder}/client.js"
    }
  ],
  "compounds": [
    {
      "name": "Server/Client",
      "configurations": ["Server", "Client"],
      "preLaunchTask": "${defaultBuildTask}",
      "stopAll": true
    }
  ]
}
Compound launch configurations are also displayed in the launch configuration dropdown menu.
Automatically open a URI when debugging a server program
Developing a web program typically requires opening a specific URL in a web browser in order to hit the server code in the debugger. VS Code has a built-in feature "serverReadyAction" to automate this task.
Here is an example of a simple Node.js Express application:
var express = require('express');
var app = express();

app.get('/', function(req, res) {
  res.send('Hello World!');
});

app.listen(3000, function() {
  console.log('Example app listening on port 3000!');
});
This application first installs a "Hello World" handler for the "/" URL and then starts to listen for HTTP connections on port 3000. The port is announced in the Debug Console, and typically, the developer would now type http://localhost:3000 into their browser application.
The serverReadyAction feature makes it possible to add a structured property serverReadyAction to any launch config and select an "action" to be performed:
{
  "type": "node",
  "request": "launch",
  "name": "Launch Program",
  "program": "${workspaceFolder}/app.js",

  "serverReadyAction": {
    "pattern": "listening on port ([0-9]+)",
    "uriFormat": "http://localhost:%s",
    "action": "openExternally"
  }
}
Here the pattern property describes the regular expression for matching the program's output string that announces the port. The pattern for the port number is put into parenthesis so that it is available as a regular expression capture group. In this example, we are extracting only the port number, but it is also possible to extract a full URI.
The uriFormat property describes how the port number is turned into a URI. The first %s is substituted by the first capture group of the matching pattern.
The resulting URI is then opened outside of VS Code ("externally") with the standard application configured for the URI's scheme.
Trigger debugging via Microsoft Edge or Chrome
Alternatively, the action can be set to debugWithEdge or debugWithChrome. In this mode, a webRoot property can be added that is passed to the Chrome or Microsoft Edge debug session.
To simplify things a bit, most properties are optional and we use the following fallback values:
- pattern:
"listening on.* (https?://\\S+|[0-9]+)"which matches the commonly used messages "listening on port 3000" or "Now listening on: https://localhost:5001". - uriFormat:
"http://localhost:%s" - webRoot:
"${workspaceFolder}"
Triggering an arbitrary launch config
In some cases, you might need to configure more options for the browser debug session, or use a different debugger entirely. You can do this by setting action to startDebugging with a name property set to the name of the launch configuration to start when the pattern is matched.
The named launch configuration must be in the same file or folder as the one with the serverReadyAction.
Here the serverReadyAction feature in action:
Next steps
- Tasks - Describes how to run tasks with Gulp, Grunt, and Jake and how to show errors and warnings.
- Variables Reference - Describes the variables available in VS Code.
Common questions
I do not see any launch configurations in the Run and Debug view dropdown. What is wrong?
The most common problem is that you did not set up launch.json or there is a syntax error in that file. Alternatively, you might need to open a folder, since no-folder debugging does not support launch configurations.