Use browser tools with agents
Browser tools give agents a visual and interactive feedback loop for web development. An agent can change your code, run the application, interact with it in the integrated browser, inspect the result, and fix problems it finds. This closed loop helps the agent verify actual behavior instead of reasoning only from source code.
Browser tools are built into Visual Studio Code and don't require an external Model Context Protocol (MCP) server. For example, you can ask:
Start the application, open it in the browser, test the sign-up flow, and fix any issues you find. Verify the fix before finishing.
How the browser feedback loop works
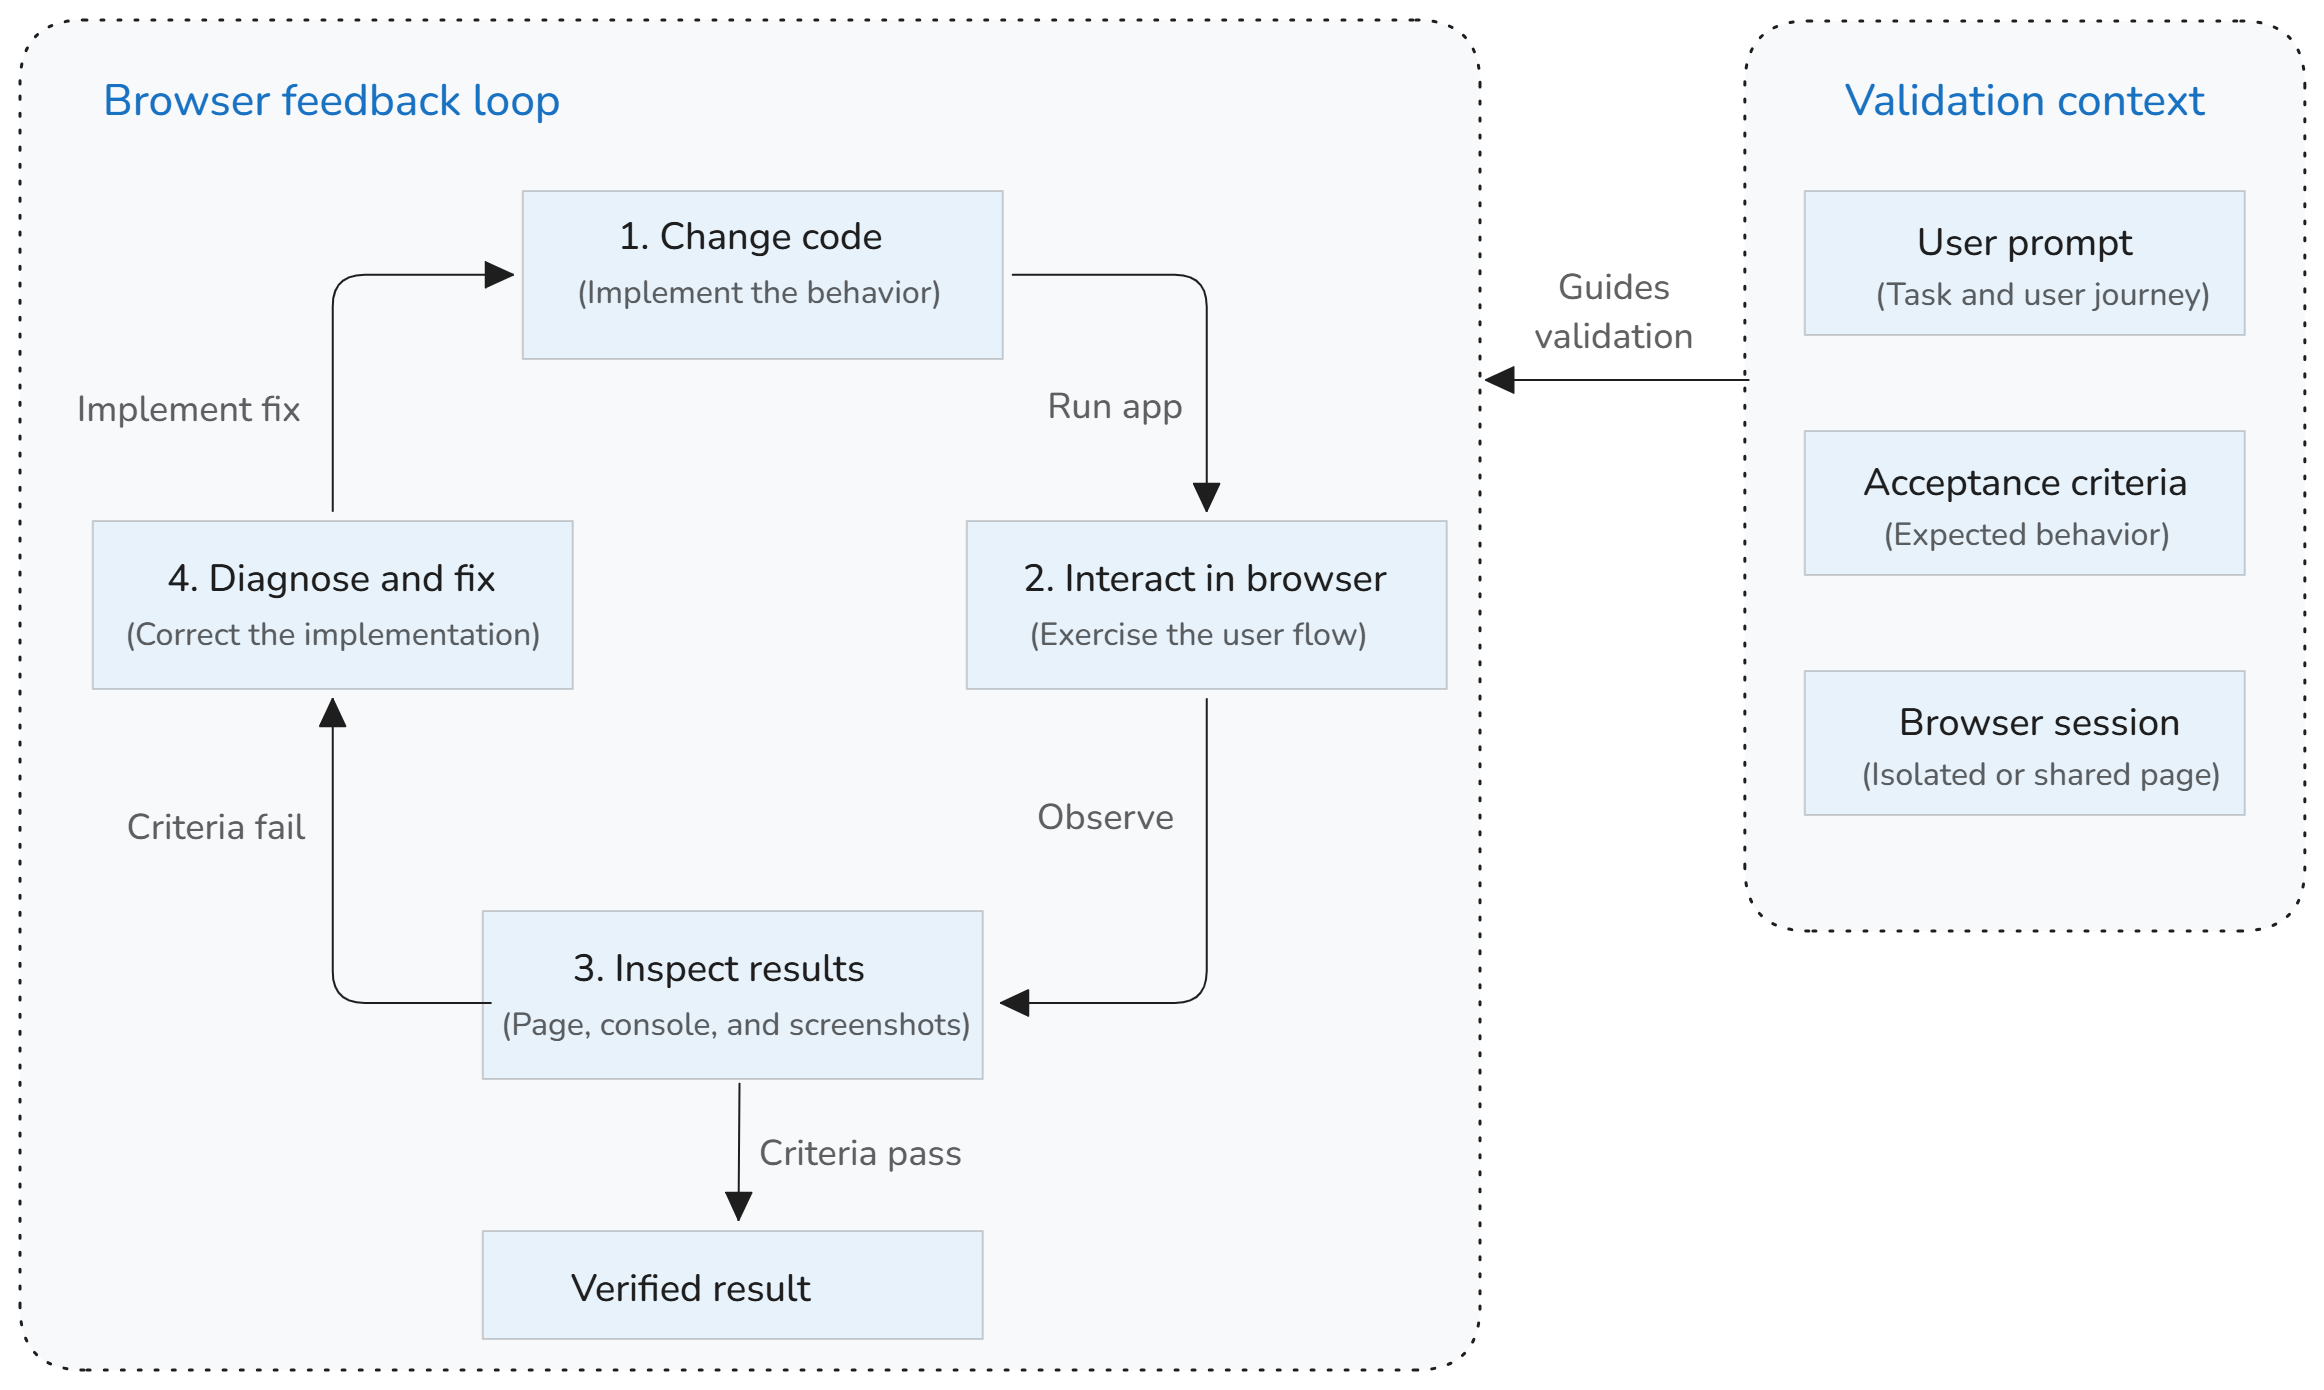
When an agent uses browser tools, it can complete and verify a web development task in a continuous loop:
- The agent changes the application code.
- The agent starts the development server or locates the running application.
- Browser tools open the application and interact with it.
- The agent analyzes page content, screenshots, console errors, and interaction results.
- The agent fixes any problems and repeats the checks.
The agent reports what it tested and the result. Review its code changes and verification results before you keep the changes.
What agents can do in the browser
Browser tools support common web development and validation tasks:
| Goal | What the agent can do |
|---|---|
| Navigate | Open pages, navigate to URLs, and follow links between routes. |
| Understand | Read page content and accessible elements, and inspect console errors. |
| Interact | Select buttons, enter text, hover over elements, drag elements, and handle dialogs. |
| Verify visually | Capture screenshots to inspect layout and the visual result. |
| Automate complex flows | Run focused Playwright code when a flow needs more control. |
The built-in browser tools include:
- Page navigation:
openBrowserPage,navigatePage. - Page content and appearance:
readPage,screenshotPage. - User interaction:
clickElement,hoverElement,dragElement,typeInPage,handleDialog. - Custom browser automation:
runPlaywrightCode.
The agent chooses tools based on your prompt and the available context. You can review the tool calls and their parameters in the chat conversation.
Get started
Browser tools are enabled by default with the workbench.browser.enableChatTools setting.
-
Start a new agent session in the Chat view or the Agents window.
-
Ask the agent to start or locate your web application, test a specific user flow, and report the result.
-
Include the expected behavior and tell the agent whether to fix and verify any problems it finds.
For example:
Start the development server and open the app in the browser.
Add a task named "Review browser tools", mark it complete, and reload the page.
Verify that the completed task persists. If any step fails, fix the issue and repeat the flow.
Select only the tools that are relevant to your task. Learn more about selecting tools for agents.
Choose a browser session
The agent can open a new page in an isolated session, or you can share a browser page that you opened. Choose based on whether the task needs your existing browser state.
| Session | Data available to the agent | Best for |
|---|---|---|
| Agent-opened page | A private, in-memory session that doesn't share cookies or storage with your other browser tabs. | Local apps, public pages, and unauthenticated flows. |
| Page shared by you | The existing session for that tab, including its cookies, storage, and sign-in state. | Authenticated or stateful flows that require your existing session. |
Let the agent open a page
Ask the agent to open a URL or test a running application. Pages opened by the agent use isolated ephemeral sessions, which protects the data in your other browser tabs.
In the Agents window, browser tabs are isolated per session. An agent can only read and interact with tabs that belong to its session.
Share an existing page
By default, an agent can't access browser pages that you opened. To grant access to a page:
- Open the page in the integrated browser.
- Select Share with Agent in the browser toolbar.
- Confirm that you want to share the page.
- Ask the agent to read or interact with the page.
A visual indicator shows that the page is shared. Select Share with Agent again to revoke access immediately.
If an agent needs access to an unshared tab, it can ask you to share one. In autopilot mode, VS Code declines these requests automatically to protect your privacy.
Give feedback from a web page
The integrated browser lets you point to the rendered result instead of describing a visual or runtime problem only in text. You can select page content, attach diagnostic information, and give element-level instructions for the agent to implement.
Use the Add to Chat actions in the browser toolbar to provide:
- Page elements: select a rendered element and attach its HTML, CSS, and optional screenshot.
- Element comments: select one or more elements and associate a specific change request with each one.
- Screenshots: capture the current viewport, a selected area, or the full page.
- Console logs: attach runtime errors and other console output.
For example, give feedback on multiple parts of a page and then let the agent validate its work:
- Open your application in the integrated browser.
- Open the Add to Chat dropdown and select Comment on Elements.
- Select the navigation menu and enter
Collapse this navigation into a menu button on narrow screens. - Select the form and enter
Align these fields and show validation errors below each input. - Add any overall instructions in the chat input and send the prompt.
- Ask the agent to implement the feedback and use browser tools to verify the result at desktop and mobile viewport sizes.
You can also select Share with Agent to let the agent continue interacting with the same page, including its current browser state. This creates a collaborative loop: you identify a problem in the rendered application, the agent implements the change, and browser tools verify the result.
For detailed procedures and browser settings, see adding browser context to AI chat.
Compare browser and chat context workflows
Browser tools are different from manually adding browser content to a chat prompt:
| Workflow | Who controls the browser | Best for |
|---|---|---|
| Browser tools | The agent navigates and interacts autonomously. | End-to-end validation and iterative fixes. |
| Add to Chat | You select elements, screenshots, or console logs to attach to a prompt. | Pointing out a specific visual or runtime issue. |
| Share with Agent | You grant the agent access to an existing browser tab. | Authenticated or stateful browser sessions. |
Use the Add to Chat actions when you want to choose the exact browser context yourself. Learn more about adding browser context to chat.
Write effective browser prompts
Describe an observable outcome so the agent knows what to exercise and how to decide whether the task is complete. Include:
- How to start the application and which URL to open.
- The user journey to follow.
- The expected result.
- Important edge cases or viewport sizes.
- Whether the agent should fix discovered problems.
- The checks the agent should repeat after a fix.
The following patterns cover common browser workflows.
Build and verify a feature
Implement the profile form from the requirements. Start the app and use the browser to verify that valid changes save, invalid input shows an error, and cancel restores the original values. Fix any issues and verify the complete flow again.
Reproduce and fix a bug
Open http://localhost:3000 and reproduce this issue: submitting the checkout form twice creates duplicate orders. Find the cause, fix it, and repeat the same browser steps to verify that only one order is created.
Review responsive behavior
Open the dashboard and inspect it at desktop and mobile viewport sizes. Verify that the navigation remains usable and no content overflows. Fix layout issues and capture screenshots of the final result.
Check accessibility
Review the sign-in page for accessible names, heading structure, and keyboard operation. Exercise the form without a mouse, fix issues you find, and verify the flow again.
Browser tools provide interactive validation during an agent session. Keep repeatable Playwright or other automated tests in your repository when the checks need to run consistently in continuous integration or guard against regressions.
Privacy and enterprise controls
VS Code provides controls over browser access:
- You explicitly approve sharing a browser tab that you opened.
- Agent-opened tabs use isolated ephemeral storage.
- In untrusted workspaces, the integrated browser always uses ephemeral storage.
- Administrators can turn off browser tools with the
BrowserChatToolspolicy. - Administrators can use agent network filtering to restrict the domains that agent tools can reach.
Learn more about approvals and permissions, browser session storage, and enterprise controls for AI.
Troubleshoot browser tools
Why are browser tools missing?
Verify that workbench.browser.enableChatTools is turned on. Then open Configure Tools in the chat input and select the tools under Built-in > Browser. An organization policy can also turn off these tools.
Why can't the agent access my signed-in page?
Pages opened by an agent use an isolated session and don't inherit your sign-in state. Open the page in the integrated browser and use Share with Agent to grant access to that authenticated tab.
Why did the agent open a separate browser tab?
An agent opens its own isolated tab unless you share an existing tab. When an open tab matches the requested domain and port, VS Code can prompt you to share it instead.
Why can't the agent reach a domain?
Agent network filtering or an organization policy might block the domain. Check the error in the tool call and contact your administrator if the setting is managed by your organization.
Next steps
- Follow the build and validate a web app with browser tools tutorial.
- Learn about the integrated browser.
- Explore testing with AI.
- Learn how tools work in the agent loop.