Develop agents with Agent Inspector in Foundry Toolkit
This article describes how to use the Agent Inspector to debug, visualize, and improve your AI agents directly in VS Code. Press F5 to launch your agent with full debugger support, view streaming responses in real time, and see how multiple agents work together.
Benefits
Agent Inspector provides the following capabilities for your agent development workflow.
| Benefit | Description |
|---|---|
| One-click F5 debugging | Launch your agent with breakpoints, variable inspection, and step-through debugging. |
| Auto-configured by Copilot | GitHub Copilot generates agent code and configures debugging, endpoints, and environment. |
| Production-ready code | Generated code uses Hosted Agent SDK, ready to deploy to Microsoft Foundry. |
| Real-time visualization | View streaming responses, tool calls, and workflow graphs between agents. |
| Quick code navigation | Double-click workflow nodes to jump to corresponding code. |
Prerequisites
- Python 3.10+ and VS Code Foundry Toolkit extension
- Python extension for VS Code for debugging support (if using Python)
Quick start
Choose one of the following options to quickly start using Agent Inspector with your agent project.
Option 1: Scaffold a sample (Recommended)
- Select Foundry Toolkit in the Activity Bar > Developer Tools > Build > Agent Inspector.
- Select Try a Sample to generate a preconfigured project.
- Follow the README to run and debug the sample agent.
Option 2: Use Copilot to create a new agent
- Select Foundry Toolkit in the Activity Bar > Developer Tools > Build > Agent Inspector.
- Select create with Copilot and provide agent requirements.
- GitHub Copilot generates agent code and configures debugging automatically.
- Follow the instructions from Copilot output to run and debug your agent.
Option 3: Start with an existing agent
If you already have an agent built with Microsoft Agent Framework SDK, ask GitHub Copilot to set up debugging for the Agent Inspector.
-
Select AIAgentExpert from the Agent dropdown.
-
Enter prompt:
Help me set up the debug environment for the workflow agent to use Foundry Toolkit Agent Inspector -
Github Copilot generates the necessary configuration files and instructions to run and debug your agent using the Agent Inspector.
Configure debugging manually
Add these files to your .vscode folder to set up debugging for your agent, and replace ${file} with your agent's entrypoint python file path.
tasks.json
{
  "version": "2.0.0",
  "tasks": [
    {
      "label": "Validate prerequisites",
      "type": "aitk",
      "command": "debug-check-prerequisites",
      "args": { "portOccupancy": [5679, 8087] }
    },
    {
      "label": "Run Agent Server",
      "type": "shell",
      "command": "${command:python.interpreterPath} -m debugpy --listen 127.0.0.1:5679 -m agentdev run ${file} --port 8087",
      "isBackground": true,
      "dependsOn": ["Validate prerequisites"],
      "problemMatcher": {
        "pattern": [{ "regexp": "^.*$", "file": 0, "location": 1, "message": 2 }],
        "background": {
          "activeOnStart": true,
          "beginsPattern": ".*",
          "endsPattern": "Application startup complete|running on"
        }
      }
    },
    {
      "label": "Open Inspector",
      "type": "shell",
      "command": "echo '${input:openTestTool}'",
      "presentation": { "reveal": "never" },
      "dependsOn": ["Run Agent Server"]
    },
    {
      "label": "Terminate All",
      "command": "echo ${input:terminate}",
      "type": "shell",
      "problemMatcher": []
    }
  ],
  "inputs": [
    {
      "id": "openTestTool",
      "type": "command",
      "command": "ai-mlstudio.openTestTool",
      "args": { "port": 8087 }
    },
    {
      "id": "terminate",
      "type": "command",
      "command": "workbench.action.tasks.terminate",
      "args": "terminateAll"
    }
  ]
}
launch.json
{
  "version": "0.2.0",
  "configurations": [
    {
      "name": "Debug Agent",
      "type": "debugpy",
      "request": "attach",
      "connect": { "host": "localhost", "port": 5679 },
      "preLaunchTask": "Open Inspector",
      "postDebugTask": "Terminate All"
    }
  ]
}
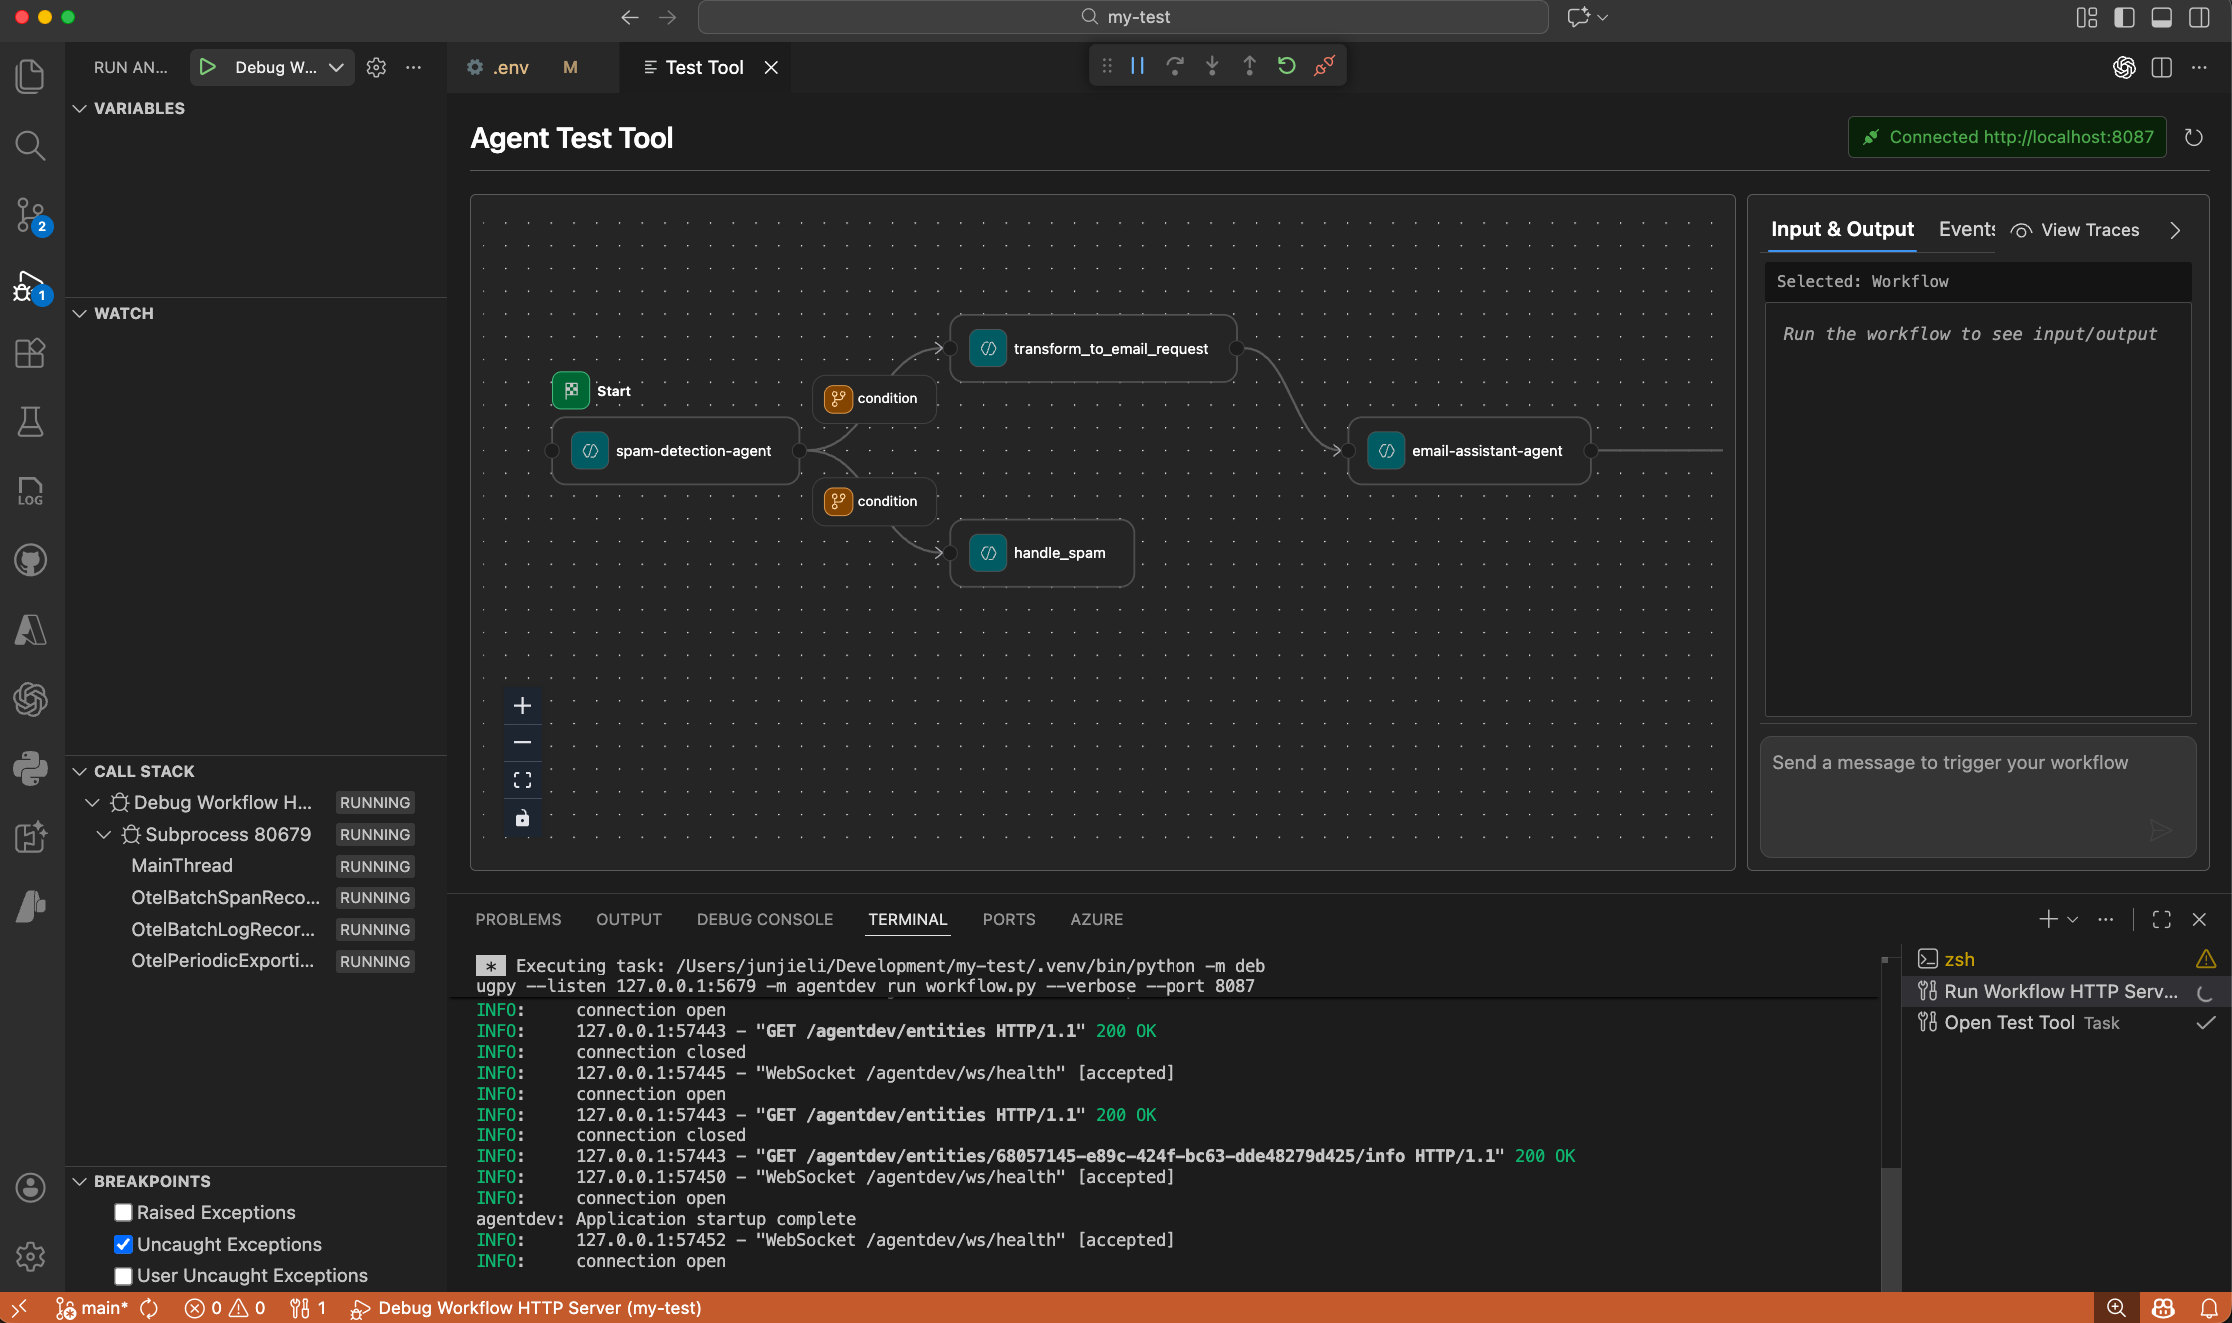
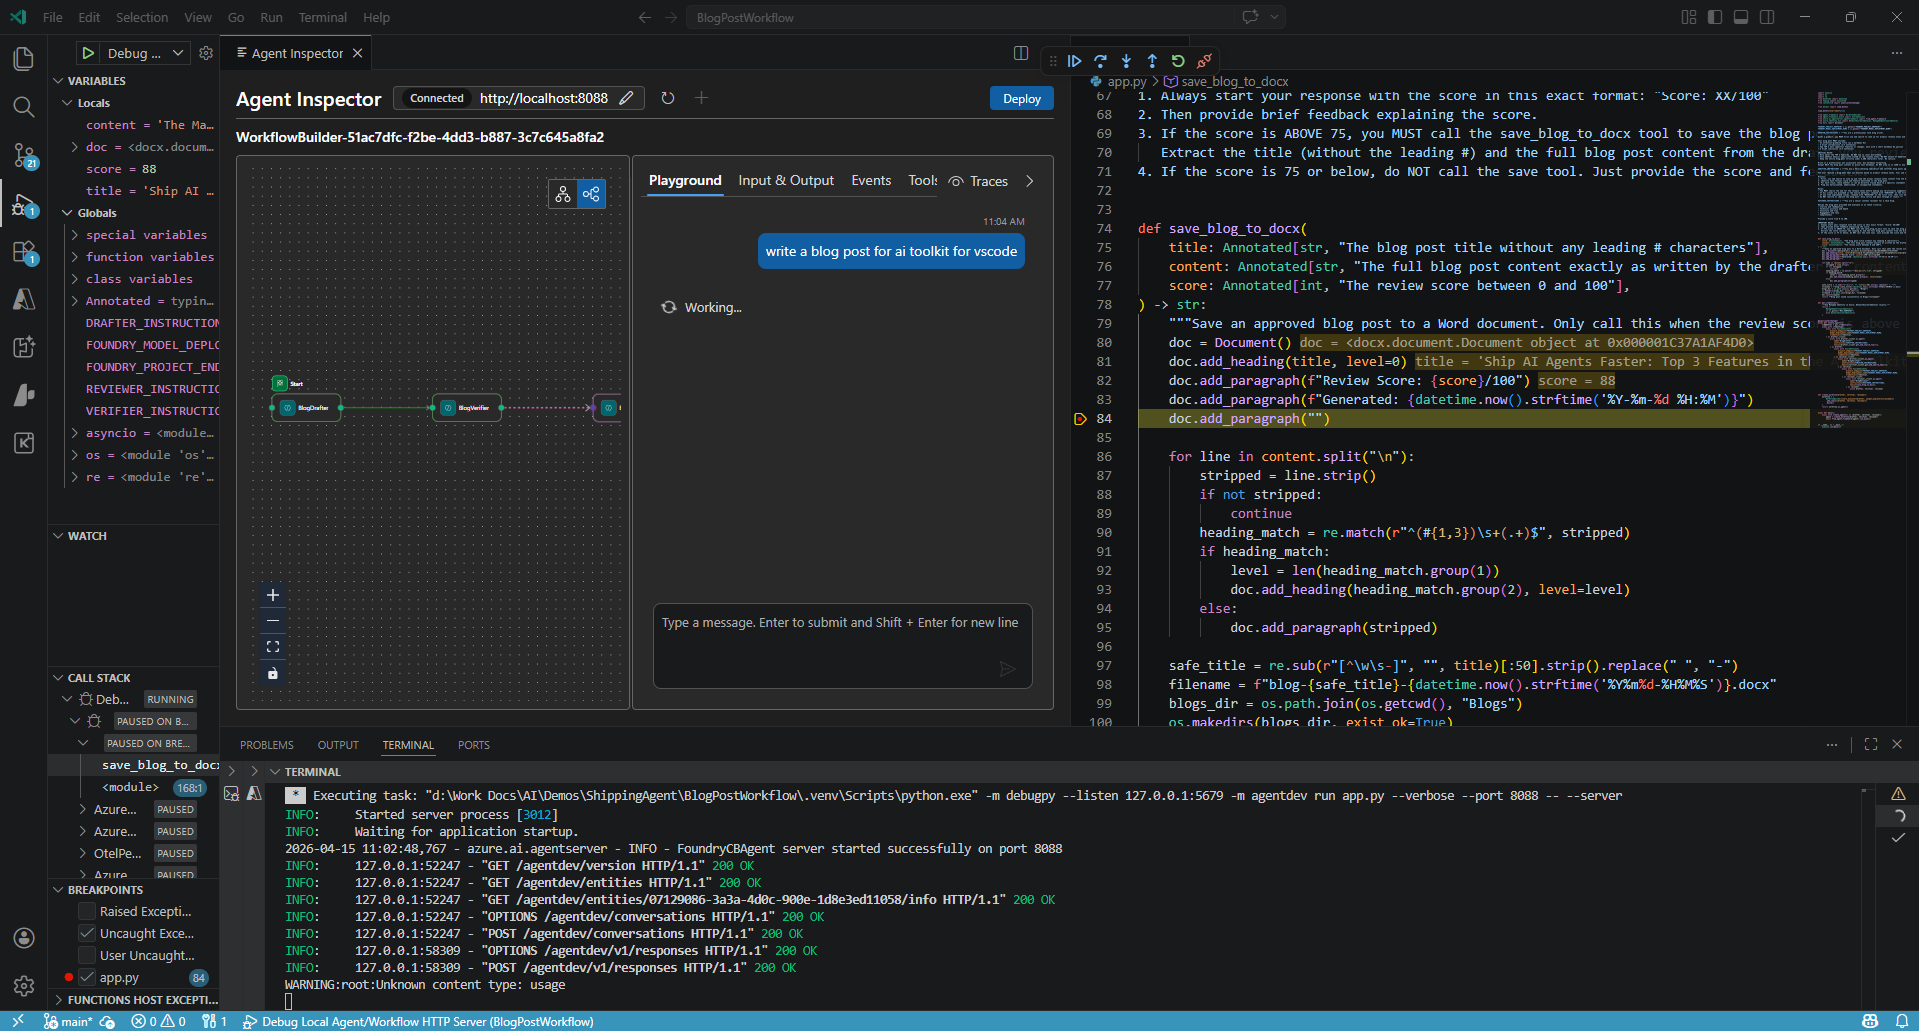
Use the Inspector
Chat playground
Send messages to trigger the workflow and view executions in real-time.
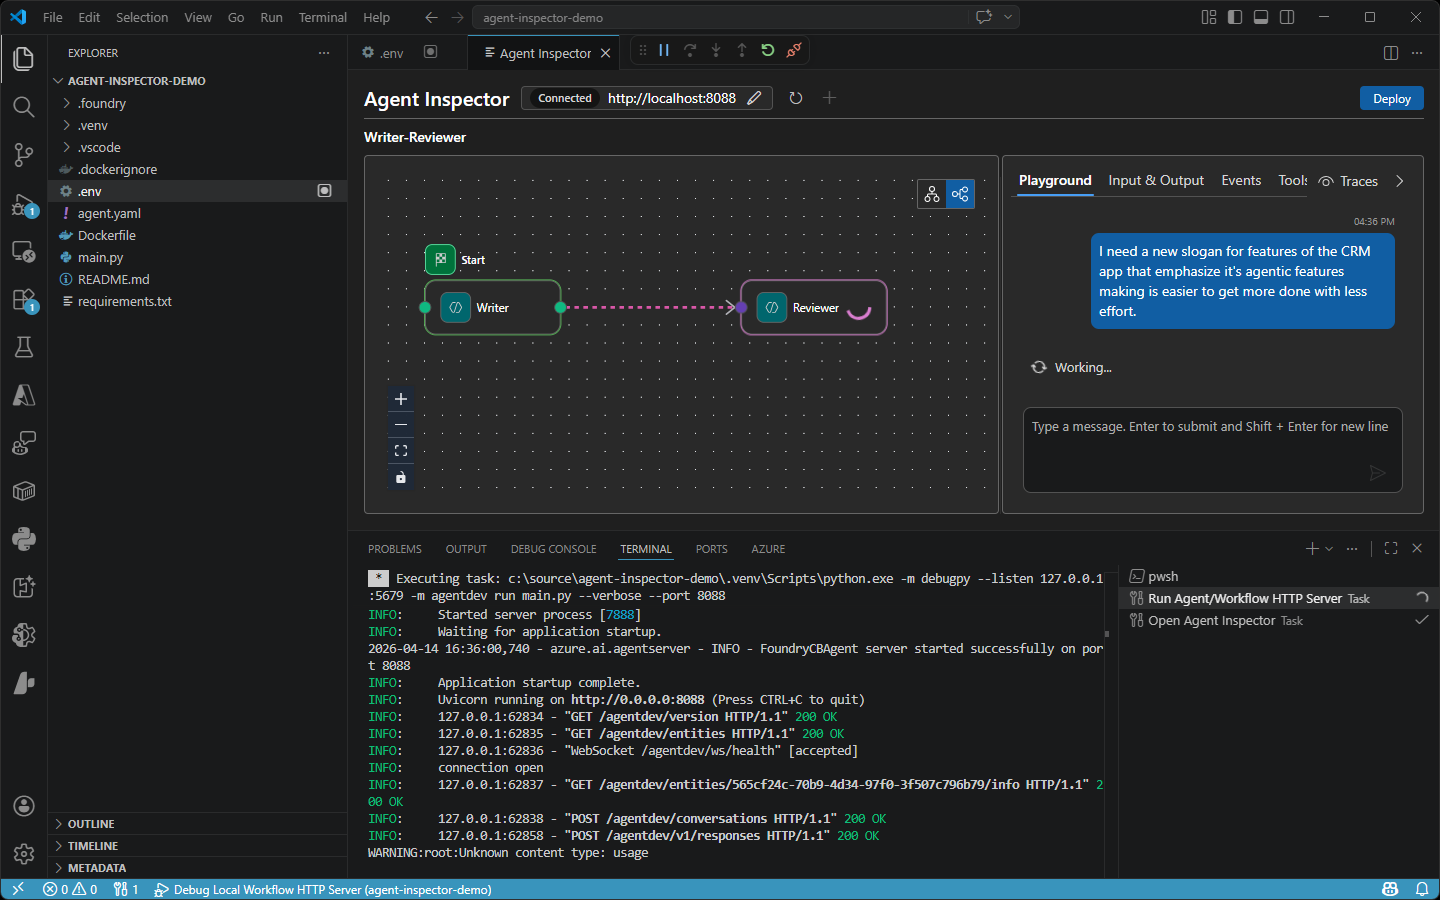
Workflow visualization
For WorkflowAgent, view the execution graph with message flows between agents. You can also:
- Select each node to review agent inputs and outputs.
- Double-click any node to navigate to the code.
- Set breakpoints in the code to pause execution and inspect variables.
Troubleshooting
| Issue | Solution |
|---|---|
| API errors | Agent Framework is evolving. Copy terminal errors to Copilot for fixes. |
| Connection failed | Verify server is running on expected port (default: 8087). |
| Breakpoints not hit | Ensure debugpy is installed and ports match in launch.json. |
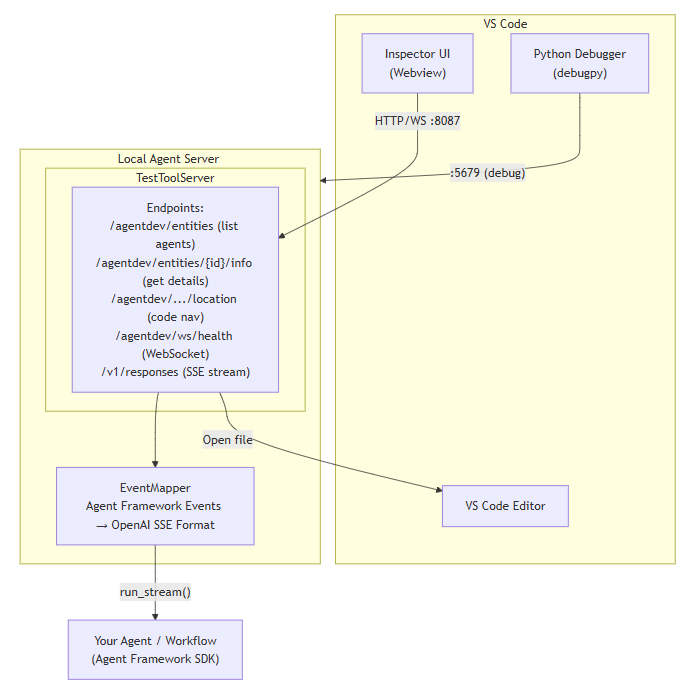
How it works
When you press F5, the Inspector:
- Starts the agent server: The
agentdevCLI wraps your agent as an HTTP server on port 8087, with debugpy attached on port 5679. - Discovers agents: The UI fetches available agents/workflows from
/agentdev/entities. - Streams execution: Chat inputs go to
/v1/responses, which streams back events via SSE for real-time visualization. - Enables code navigation: Double-click workflow nodes to open the corresponding source file in the editor.
Architecture overview
The agentdev CLI launches a local TestToolServer that wraps your agent as an HTTP server on port 8087. The Inspector UI (a VS Code webview) communicates with this server over HTTP and WebSocket to list agents, stream SSE responses, and trigger code navigation in the editor. An EventMapper converts Agent Framework events into OpenAI-compatible SSE format, and a Python debugger (debugpy) attaches on port 5679 for step-through debugging. Your agent or workflow runs via run_stream() through the Agent Framework SDK.