June 2023 (version 1.80)
Update 1.80.1: The update addresses these issues.
Update 1.80.2: The update addresses this security issue.
Downloads: Windows: x64 Arm64 | Mac: Universal Intel silicon | Linux: deb rpm tarball Arm snap
Welcome to the June 2023 release of Visual Studio Code. There are many updates in this version that we hope you'll like, some of the key highlights include:
- Accessibility improvements - Accessible View for better screen reader support, Copilot audio cues.
- Better editor group and tab resizing - Set min tab size, avoid unnecessary editor group resizing.
- Skip subwords when expanding selection - Control whether to use camel case for selection.
- Terminal image support - Display images directly in the integrated terminal.
- Python extensions for mypy and debugpy - For Python type checking and debugging in VS Code.
- Remote connections to WSL - Connect to WSL instances on remote machines using Tunnels.
- Preview: GitHub Copilot create workspace/notebook - Quickly scaffold projects and notebooks.
- New C# in VS Code documentation - Learn about C# development with the C# Dev Kit extension.
If you'd like to read these release notes online, go to Updates on code.visualstudio.com.
Insiders: Want to try new features as soon as possible? You can download the nightly Insiders build and try the latest updates as soon as they are available.
Accessibility
Accessible View
A new command Open Accessible View (⌥F2 (Windows Alt+F2, Linux Shift+Alt+F2)) allows screen reader users to inspect content character by character, line by line. Invoke this when a hover or chat panel response is focused.
Accessibility help improvements
A new command Open Accessibility Help (⌥F1 (Windows Alt+F1, Linux Shift+Alt+F1)) opens a help menu based on the current context. It currently applies to the editor, terminal, notebook, chat panel, and inline chat features.
Disable the accessibility help menu hint and open additional documentation, if any, from within the help menu.
Accessibility help for notebooks
A new accessibility help menu was added for notebooks to provide information about the editor layout and navigating and interacting with the notebook.
Chat audio cues
There are now audio cues for the GitHub Copilot chat experience and can be enabled via audioCues.chatRequestSent, audioCues.chatResponsePending, and audioCues.chatResponseReceived.
Chat accessibility improvements
Chat responses are provided to screen readers as soon as they come in and the inline and chat panel accessibility help menus contain more detailed information about what to expect and how to interact with each feature.
Settings editor alt text improvements
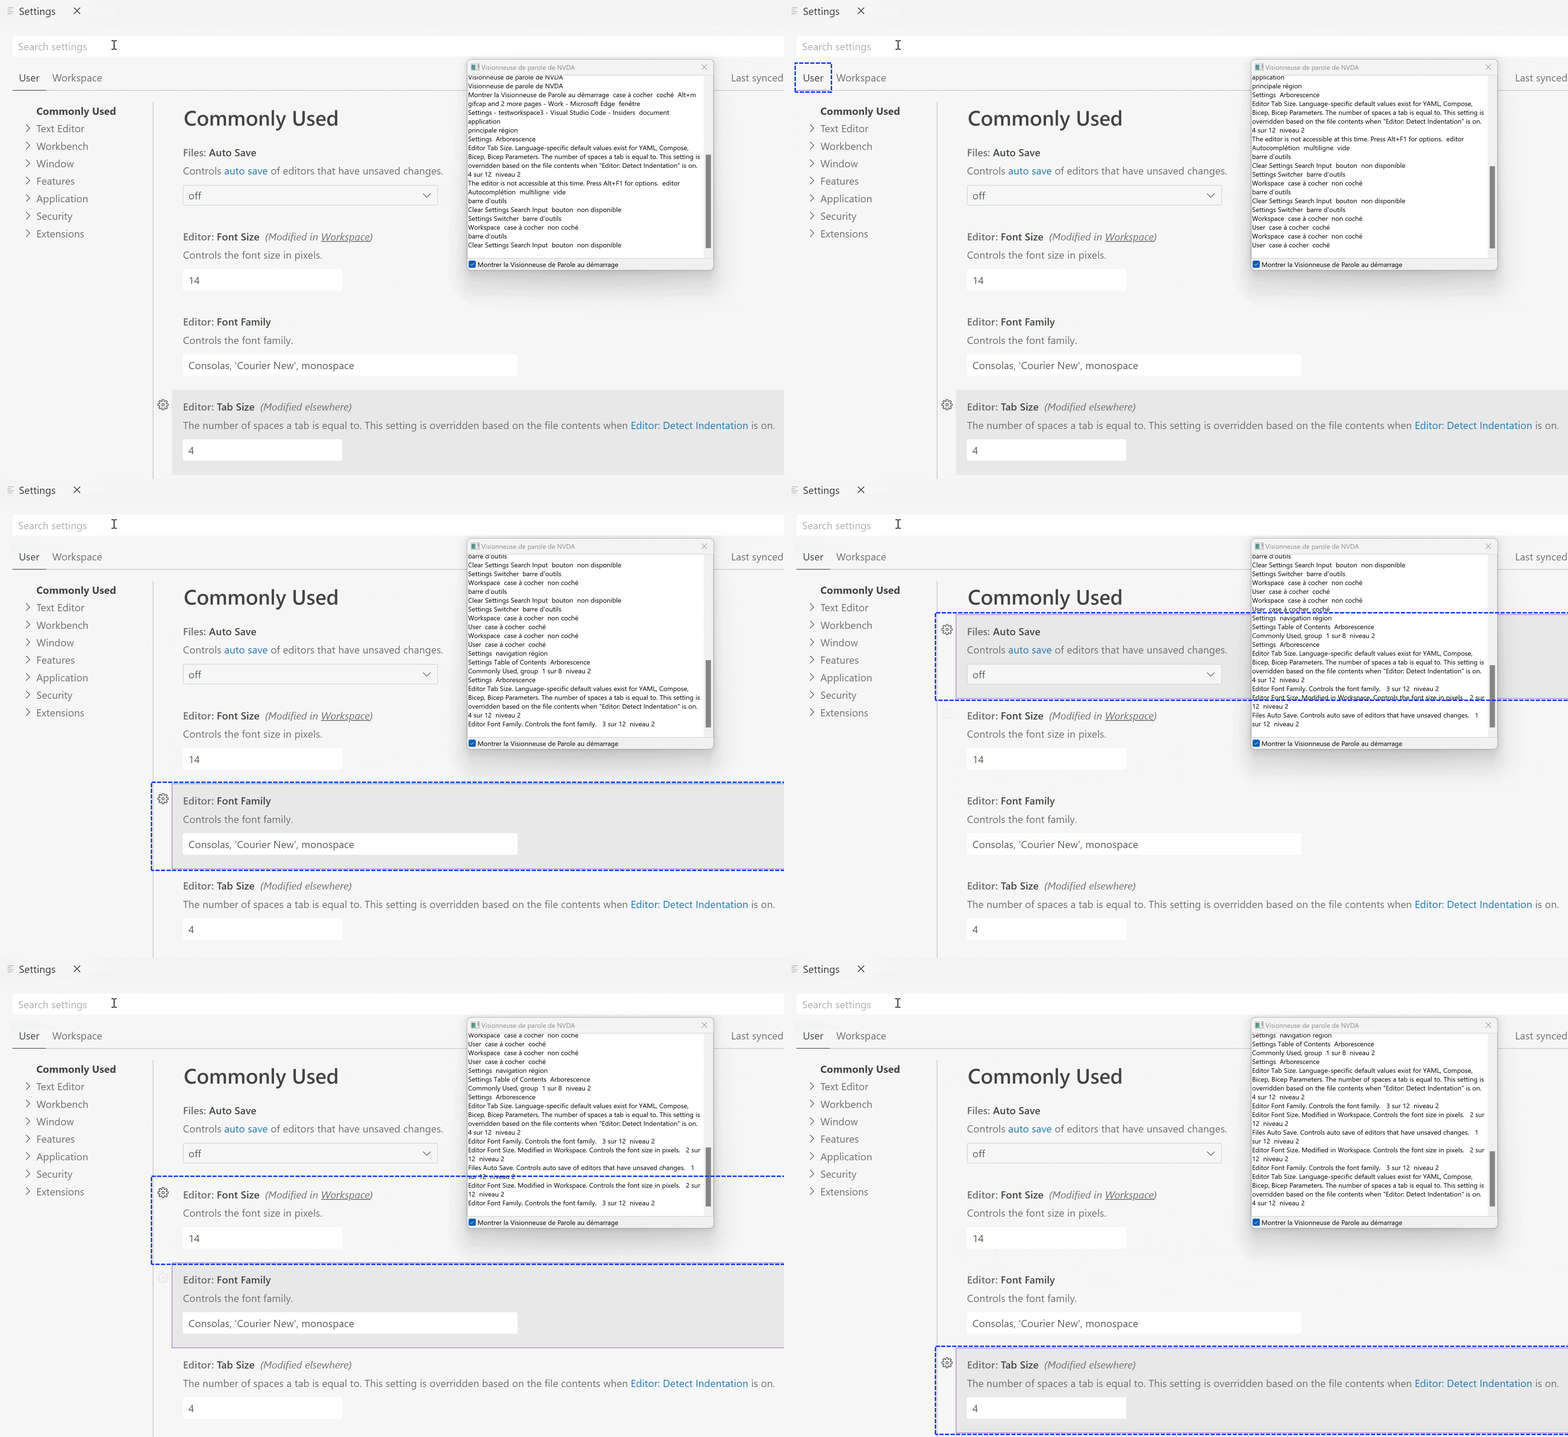
The Settings editor (accessible through the Preferences: Open Settings (UI) command) is now less verbose when navigating with a screen reader. In particular, the Settings scope switcher announces the actual name of the scope rather than a file path, and the settings description alt text has been cleaned up to not include raw Markdown formatting.
Workbench
Auto playing and looping for previewed videos
You can now enable video autoplaying and looping for the built-in video file preview. The relevant settings are:
mediaPreview.video.autoPlay— Enable video autoplay. Autoplayed videos are automatically muted.mediaPreview.video.loop— Enable video looping.
These settings are off by default.
More help when editor is readonly
With the introduction of readonly mode in VS Code last milestone, editors can be readonly due to workspace configuration.
This milestone, we enhanced the notification message in the editor when you try to type in a readonly editor and in some cases provide a link to change the files.readonly settings.
Default file dialog location
A new setting files.dialog.defaultPath can configure the default location that file dialogs (for example when opening or saving files or folders) should show when they open. This default is used only as a fallback when no other location is known, for example in empty VS Code windows.
Disable maximizing editor groups on tab double click
A new setting workbench.editor.doubleClickTabToToggleEditorGroupSizes disables toggling the size of an editor group from maximized to restored when double-clicking on a tab of that group.
Control minimal width of fixed width tabs
A new setting workbench.editor.tabSizingFixedMinWidth controls the minimum size of a tab when workbench.editor.tabSizing is set to fixed. Fixed tab widths are explained in more detail in the 1.79 release notes.
Editor group split sizing changed to 'auto'
A new value for the workbench.editor.splitSizing setting called auto is the new default. In this mode, splitting an editor group distributes the available size evenly to all editor groups only if none of the editor groups has been resized. Otherwise, the space of the split editor group is divided in half and placed in the new editor group.
The intent of this change is to not break layouts that you have created when you split, but still preserve the previous default behavior of distributing the size evenly otherwise.
Search .gitignore exclude behavior
When search.useIgnoreFiles is set to true, the workspace's .gitignore is now respected regardless of whether the workspace is initialized as a Git repository or not.
Max height for comments
The setting comments.maxHeight lets you disable the max height restriction on the comments, such as those displayed for pull requests when using the GitHub Pull Requests and Issues extension.
Troubleshoot issues in VS Code
There is a new command Help: Troubleshoot Issue in the Command Palette to help you troubleshoot an issue in VS Code. The launched workflow helps you identify the cause for an issue using a special Troubleshoot profile and the extension bisect feature of VS Code. Extension bisect will enable and disable your installed extensions in a binary search while you indicate whether the issue reproduces or not. This narrows down the extension causing the issue and helps you provide the right information when reporting an issue.
Disable Chromium sandbox
If you have scenarios where launching VS Code desktop as an elevated user is unavoidable, for example you are launching VS Code with sudo on Linux or as administrator in an AppLocker environment on Windows, then you need to launch VS Code with the --no-sandbox --disable-gpu-sandbox command line options to have the application work as expected.
Based on the feedback in issue #184687, there are now two new settings to make it easier when you need to disable the Chromium sandbox:
-
A new command line option
--disable-chromium-sandboxto disable the Chromium sandbox for all processes in the application. This new option can be used as a replacement for--no-sandbox --disable-gpu-sandbox. This option applies to any new process sandboxes that might be added by the runtime in future releases. -
To persist disabling the Chromium sandbox across launches, do the following:
- Open the Command Palette (⇧⌘P (Windows, Linux Ctrl+Shift+P)).
- Run the Preferences: Configure Runtime Arguments command.
- This command opens a
argv.jsonfile to configure runtime arguments. You might see some default arguments there already. - Add
"disable-chromium-sandbox": true. - Restart VS Code.
Note: Do not use this setting unless you are seeing issues!
Editor
Skip subword when shrinking and expanding selection
The Expand and Shrink Selection commands can now be configured to skip subwords. This is done via the editor.smartSelect.selectSubwords setting. By default, subwords are selected but this can now be disabled.
true-> Co|deEditor selects[Code]Editor, then[CodeEditor]false-> Co|deEditor selects[CodeEditor]
This setting comes in handy when you use expand and shrink selection frequently with multiple cursors and on heterogeneous words.
Improved Emmet support for CSS modules in JSX/TSX
Emmet supports a new set of abbreviations for JSX/TSX files. By typing ..test in a JSX or TSX file, and expanding the abbreviation, the line <div styleName={styles.test}></div> is added.
The attribute name and value prefix can be configured using the emmet.syntaxProfiles setting. By configuring the emmet.syntaxProfiles setting as follows:
"emmet.syntaxProfiles": {
    "jsx": {
        "markup.attributes": {
            "class*": "className",
        },
        "markup.valuePrefix": {
            "class*": "myStyles"
        }
    }
}
and then expanding the abbreviation ..test in a JSX or TSX file, you get the abbreviation <div className={myStyles.test}></div> instead.
Resizable content hover
It is now possible to resize the content hover control. You can hover over the control borders and drag the sashes to change the size of the hover.
Terminal
Image support
Images in the terminal, which were previewed last release, are now enabled by default. Images in a terminal typically work by encoding the image pixel data as text, which is written to the terminal via a special escape sequence. The current protocols supported are sixel and the inline images protocol pioneered by iTerm.
To test images manually, you can download and cat a .six example file from the libsixel repository:
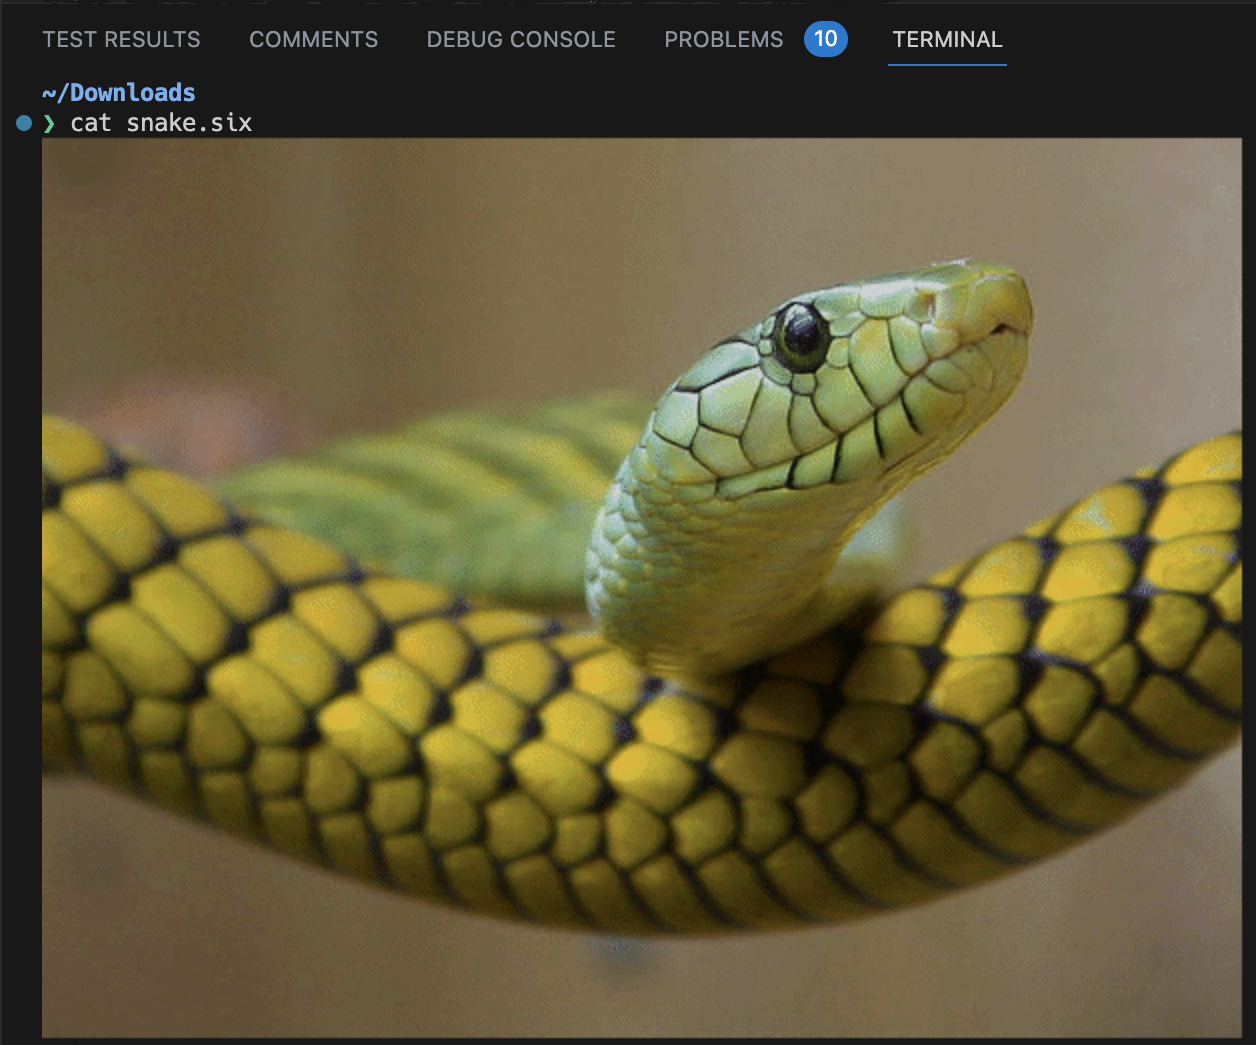
Or use the imgcat python package or imgcat script with a .png, .gif, or .jpg file:

This feature can be disabled by setting:
"terminal.integrated.enableImages": false
Multi-line and range link formats
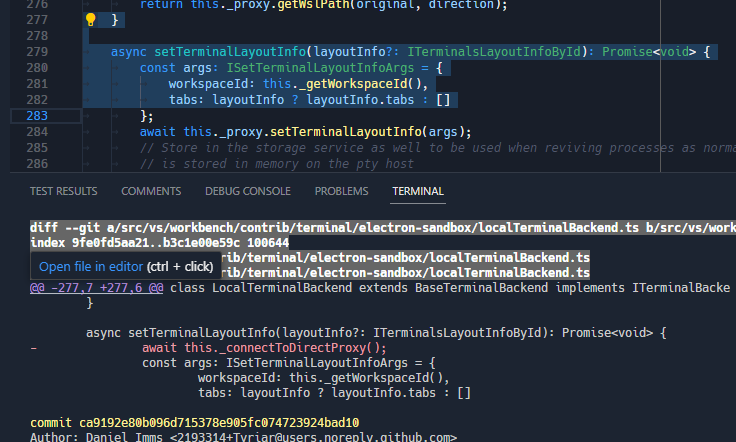
There is now support for new link formats, including links that need to scan upwards in order to find the file and links that have a range (line to line or character to character).
-
@@ git range links:
-
OCAML's Dune-style range links:


-
ESLint-style multiple line links:

-
Ripgrep-style multiple line links:

Deprecated shell and shellArgs settings removed
The settings terminal.integrated.shell.* and terminal.integrated.shellArgs.* were replaced by terminal profiles over a year ago and have just been removed. If you're still using the old shell and shellArgs settings, here is an example before/after to help with migrating:
// Before
{
  "terminal.integrated.shell.windows": "pwsh.exe",
  "terminal.integrated.shellArgs.windows": ["-Login"],

  "terminal.integrated.shell.osx": "bash",
  "terminal.integrated.shellArgs.osx": ["-l"],
}

// After
{
  "terminal.integrated.profiles.windows": {
    "PowerShell Login": {
      // Source is a special property that will use VS Code's logic to detect
      // the PowerShell or Git Bash executable.
      "source": "PowerShell",
      "args": ["-Login"],
      "icon": "terminal-powershell"
    },
  },

  "terminal.integrated.profiles.osx": {
    // This will override the builtin bash profile
    "bash": {
      "path": "bash",
      "args": ["-l"],
      "icon": "terminal-bash"
    }
  }
}
Testing
Terminal output support
Previously, test output shown in the Test Results view would always be shown in an embedded text editor. This stripped it of rich styling such as colors, styles, and symbols it may have had when run in a terminal. In this release, we show output in a real xterm.js terminal.

Theme: Codesong (preview on vscode.dev)
Now that the Test Results view is fully featured, the commands to Show Test Output have been redirected to open the Test Results view instead of creating a temporary terminal.
Source Control
Close repository improvements
In the past, users could close a repository either using the Git: Close Repository command or the Close Repository action in the Source Control view but there were certain actions (for example, opening a file from the closed repository) that would reopen the closed repository. This milestone we have made some improvements so the fact that a repository is closed is now persisted per workspace. Users can reopen closed repositories using the Git: Reopen Closed Repositories... command.
Notebooks
Improved save performance for Remote Development
Previously, saving a notebook in VS Code's Remote extension required sending the entire notebook to the extension host, which could be slow for large notebooks or slow network connections with auto save enabled. We have improved performance by only sending the changes to the notebook to the extension host, resulting in faster notebook saving and execution. While this feature is still disabled by default, we are confident that we will be able to enable it soon. To try it out, add "notebook.experimental.remoteSave": true to your settings. For more details, you can follow issue #172345.
Notebook global toolbar rework
The notebook editor's global toolbar has been rewritten to adopt the workbench toolbar, allowing users greater customization of the toolbar actions. Users can now right-click and hide actions from the toolbar. Right-clicking on an action within the toolbar presents the option to hide that action, and also to reset the menu and bring back hidden actions.
The toolbar continues to work with all three label strategies: always, never, and dynamic. You can change the label strategy via the setting notebook.globalToolbarShowLabel.
Theme: Monokai Pro (Filter Ristretto) (preview on vscode.dev)
Interactive Window backup and restore
The Python Interactive Window is now fully integrated with the hot exit feature and restores the editor state between VS Code reloads. The interactiveWindow.restore setting no longer has any effect and was removed.
If hot exit is disabled, there is a prompt when closing VS Code giving you the option to save the editor state as a .ipynb file.
_Theme: Bearded Theme feat. Gold D Raynh (preview on vscode.dev)
Languages
Markdown copy image from preview
A new context menu for images in the Markdown preview allows you to copy the image from the preview and paste it into the Markdown editor. When copying the image, the preview editor must be focused.
Markdown format pasted URLs as Markdown links
The new markdown.editor.pasteUrlAsFormattedLink.enabled setting (default false) lets you insert links into the Markdown editor that are automatically formatted into Markdown links. If you select some text to be replaced with the pasted link, the selected text will automatically become the title of the link. If no text is selected, there will be a default link title. This feature applies to external browser links as well as files within the workspace.
You must enable the setting editor.pasteAs.enabled for this new setting to work.
Remote Development
The Remote Development extensions, allow you to use a Dev Container, remote machine via SSH or Remote Tunnels, or the Windows Subsystem for Linux (WSL) as a full-featured development environment.
You can learn about new extension features and bug fixes in the Remote Development release notes.
Remote menu
This milestone, we have updated the Remote menu with entries to help you quickly install and get started with remote connections (SSH, Remote Tunnels, GitHub Codespaces, etc.) by installing the necessary extensions. There is also a Connect to... start entry on the Welcome page to help you get started with remote connections from VS Code desktop.
We have also updated the Welcome page on vscode.dev with a start entry to connect to a Remote Tunnel.
WSL over Tunnels
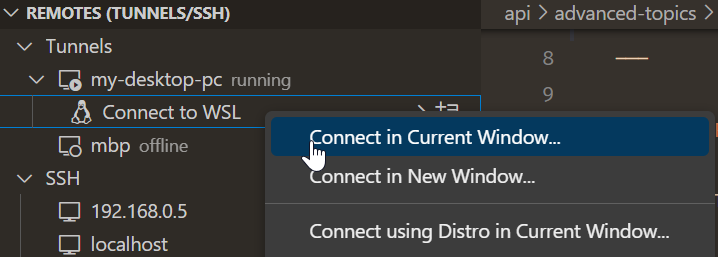
Last iteration, we previewed connecting to WSL over Remote Tunnels. This feature is now stable this iteration. If you run a Remote Tunnel on a Windows machine with WSL installed, you have the option to connect to WSL directly from the Remote Explorer.
Theme: Codesong (preview on vscode.dev)
This feature now works on VS Code desktop as well as vscode.dev. If you're already running a tunnel on your Windows device, make sure to update VS Code to the latest version to enable this feature.
Contributions to extensions
GitHub Copilot
We have introduced preview-only slash commands in the Chat view to help you create projects and notebooks and search for text in your workspace.
Note: To get access to the Chat view, inline chat, and slash commands (for example
/search,/createWorkspace), you need to install the GitHub Copilot Chat extension.
Create workspaces
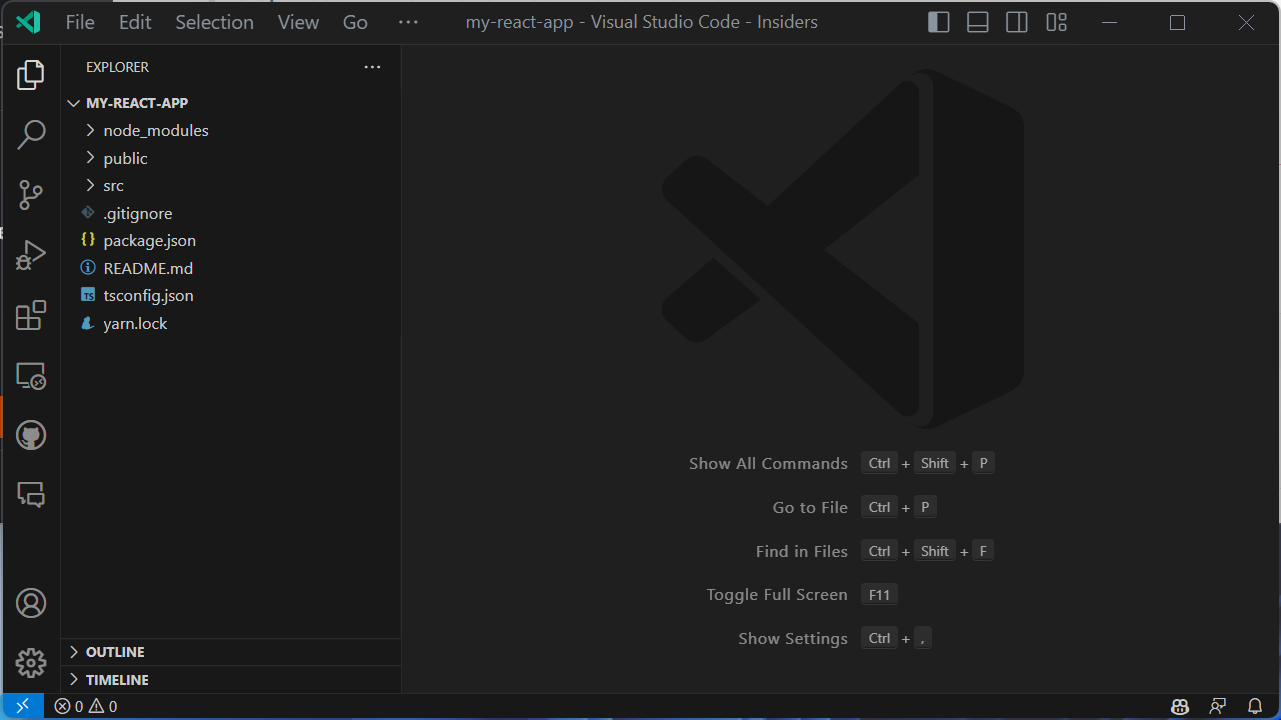
You can ask Copilot to create workspaces for popular project types with the /createWorkspace slash command. Copilot will first generate a directory structure for your request.
You can then use the Create Workspace button to create and open the project directory as a new workspace.
Create notebooks
You can ask Copilot to create Jupyter notebooks based on your requirements with the /createNotebook slash command. Copilot will generate an outline of the notebook based on your requirements.
You can then use the Create Notebook command to create the notebook and fill in the code cells based on the suggested outline.
Generate search parameters
You can ask Copilot to autofill the search parameters in workspace search. To do this, use the /search command followed by a description of what you want to find in text.
These preview slash commands can be enabled by configuring github.copilot.advanced setting as follows:
"github.copilot.advanced": {
   "slashCommands": {
      "createWorkspace": true,
      "createNotebook": true,
      "search": true
   }
}
Copilot YouTube playlist
There is a new installment covering Copilot for PowerShell in the VS Code Copilot Series on YouTube. In case you missed the series, you'll also find other language-specific talks and guidance on effective prompting when using Copilot for development.
Python
Mypy extension
There is now a Mypy Type Checker extension that provides type checking support for Python using mypy, available in preview as a pre-release version. This new extension offers errors and warnings on your entire codebase, instead of only the current file. It also uses dmypy for faster type checking.
If you have any issues with this new extension or wish to provide feedback, you can file an issue in the Mypy extension GitHub repo.
Debugpy extension
When support for Python 2.7 and Python 3.6 was removed from the Python extension, we received a lot of feedback from users who were unable to upgrade their codebase to the latest versions of Python and lost the ability to debug their applications with the latest versions of the Python extension. To work towards a solution for this, we have created a separate Python Debugger extension called Debugpy. By keeping the debugger separate from the Python extension, you will eventually be able to use the latest version of the Python extension while using an older version of the debugger (by disabling extensions auto-update). This extension is available in preview as a pre-release version using the latest version of debugpy. We plan to support older versions of debugpy in the near future.
Give it a try and let us know if everything works appropriately. Our plan is to deprecate the built-in debugging functionality in favor of this separate extension.
Pylance localization
The Pylance extension is now localized! This means settings, commands, and other text from the extension are translated to your preferred language if you have a Language Pack installed and set to active in VS Code.
Test discovery and run rewrite
This month we are continuing the rollout of our testing rewrite as an experiment. As a reminder, this rewrite redesigns the architecture behind test discovery and execution for both unittest and pytest in the extension. The rewrite is currently active for 100% of VS Code Insiders users and will begin ramping into stable this month. The rewrite will be adopted shortly, but for now the setting to opt in and out, pythonTestAdapter, still exists.
Dynamic run results for pytest and unittest
Rolling out with the new experiment is dynamic run results for pytest and unittest. Previously, our test results were only returned once all tests finished running, but now with this feature, test results are delivered individually allowing you to see your tests pass and fail in real time.
Index persistence for 3rd-party libraries
Pylance performs indexing of third-party libraries that are installed in your environment to enable IntelliSense features such as auto-completion, auto-import, code navigation, etc. Previously, Pylance would index these libraries every time you opened a workspace in VS Code. Now, Pylance persists the index for these libraries, reducing the need for repetitive indexing processes.
Deprecation of Python 3.7 support
Python 3.7 reached end-of-life (EOL) on 2023-06-27. As such, official support for Python 3.7 from the Python extension will stop in three months in the 2023.18 release of the extension (which corresponds with the September 2023 release of VS Code). There are no plans to actively remove support for Python 3.7, and so we expect the Python extension will continue to work unofficially with Python 3.7 for the foreseeable future.
With all other releases of Python now on an annual release cadence, we expect to stop official support for a Python release once it reaches EOL in the first Python extension release of the following calendar year. For example, Python 3.8 is scheduled to reach EOL in October 2024, so the first Python extension release in 2025 will stop official support.
GitHub Pull Requests and Issues
There has been more progress on the GitHub Pull Requests and Issues extension, which allows you to work on, create, and manage pull requests and issues.
- Up to 1000 (from the previous 100) comment threads can be loaded in a pull request.
- The new VS Code API proposal for a read-only message lets you check out a PR directly from an unchecked-out diff.
- Avatars in trees and comments are circles instead of squares.
Review the changelog for the 0.68.0 release of the extension to learn about the other highlights.
Preview Features
TypeScript 5.2 support
This update includes support for the upcoming TypeScript 5.2 release. Check out the TypeScript 5.2 iteration plan for more details about what the TypeScript team is currently working on. Upcoming tooling highlights include:
- A new Inline constant refactoring.
- A new Move to file refactoring that lets you move a symbol into an existing file.
To start using the TypeScript 5.2 nightly builds, install the TypeScript Nightly extension.
New diff editor
This iteration we finished rewriting the diff editor. The rewrite allowed us to add a couple of new features, to improve the performance, and to fix several bugs.
To try out the new diff editor, add "diffEditor.experimental.useVersion2": true to your settings. The new diff editor is still experimental, but will eventually replace the current diff editor in a future update.
All presented features require the new diff editor.
Collapse unchanged regions
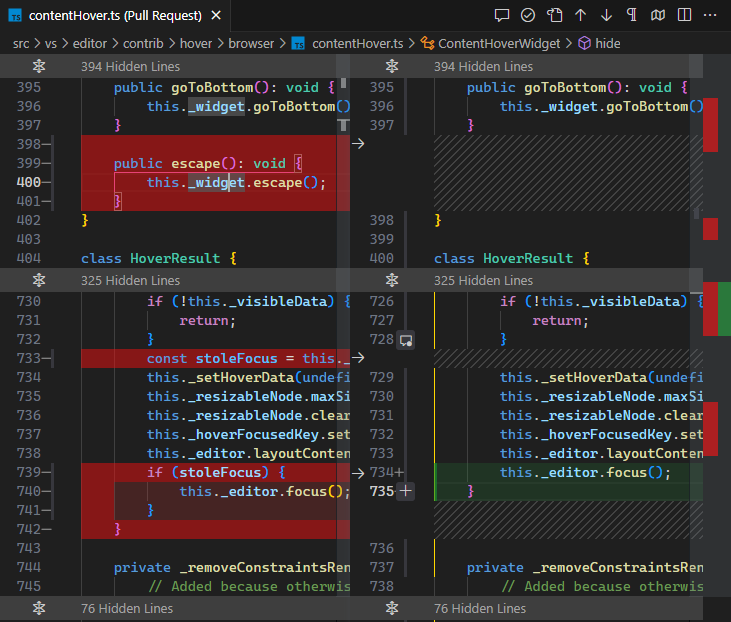
Use diffEditor.experimental.collapseUnchangedRegions to enable hiding unchanged regions in the new diff editor. This feature is useful when reviewing large diffs with a lot of unchanged code.
The borders of the hidden-lines blocks can be dragged or clicked to reveal code from the bottom or top.
Show insertion/deletion markers
Insertion/deletion markers indicate where in a line words were inserted or deleted, which is especially helpful when a line has both insertions and deletions.
Use diffEditor.experimental.showEmptyDecorations to enable/disable insertion and deletion markers.

Improved decorations
Full line deletions/insertions now have a full width background color. This reduces noise significantly.
This is an example of how the new diff editor highlights changes:

This is how the old diff editor renders decorations (notice how the line 57 on the right does not have a full width background color):

Synchronous diff update
When typing in the new diff editor, changes are heuristically applied immediately and trigger an asynchronous diff computation after some delay. In the old diff editor, changes were not applied immediately, causing visible flickering when typing.
New - the diffs update immediately when typing:

Old - there is some visible flickering:

Move detection
This experimental feature detects moved code blocks within a file. Use diffEditor.experimental.showMoves to turn it on. At the moment, only simple moves are detected, but we plan to improve this feature in the future. Once a moved code block is selected, source and target locations are aligned and a diff between them is shown.
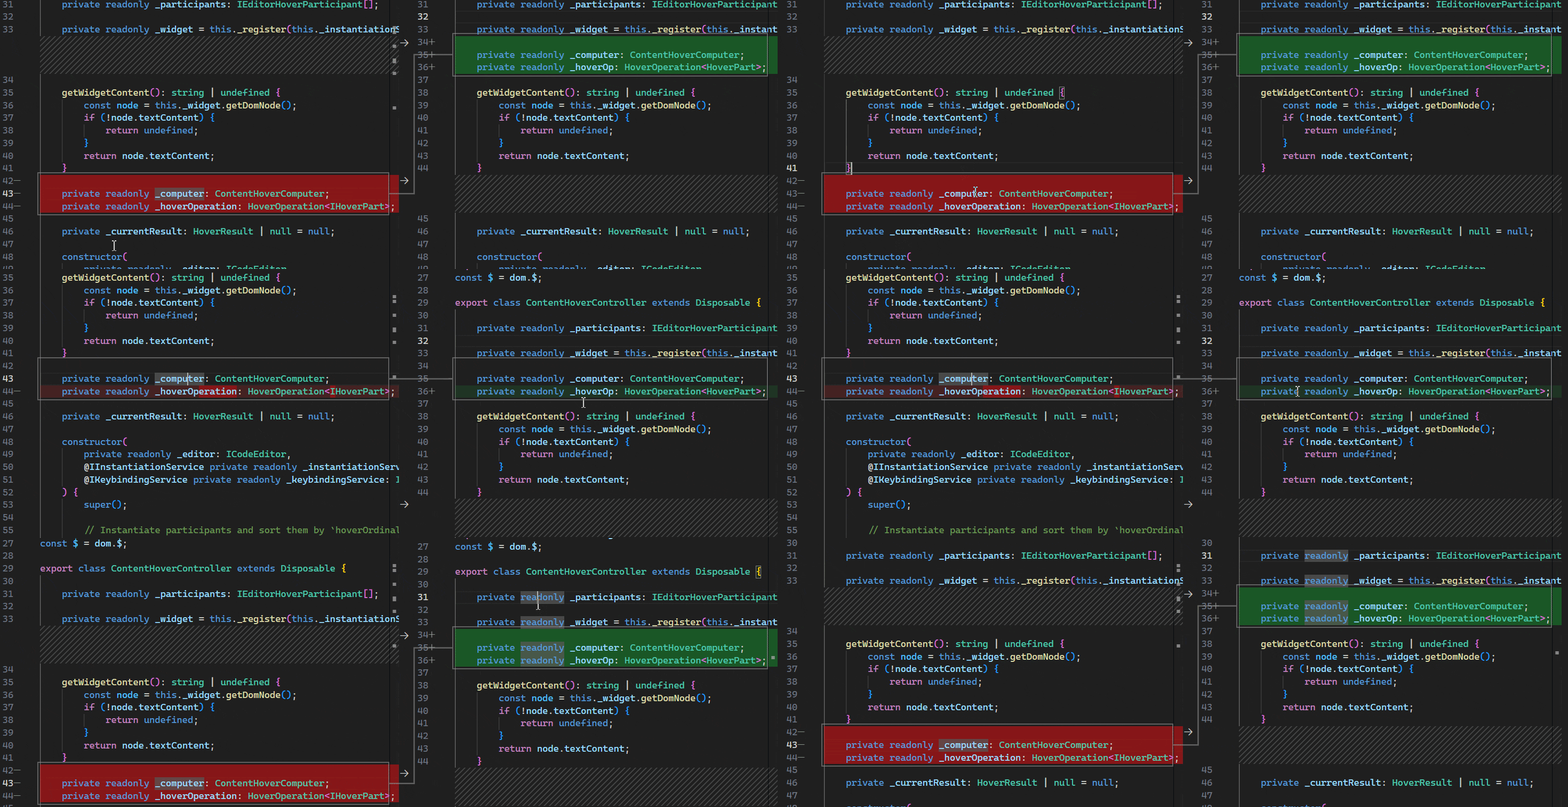
Because move detection is still experimental, expect significant changes in future updates.
Extension authoring
SecretStorage API now uses Electron API over keytar
The SecretStorage API has been the recommended way to store secrets like passwords, access tokens, etc. for years now. Under the hood, it has been using keytar, an abstraction layer used to store secrets in the OS keyring. Due to the deprecation and archiving of keytar, we looked for other solutions for the problem, specifically looking to our runtime, Electron, for a solution.
This release, we've started the move from keytar to Electron's safeStorage API. This switch should be transparent to you as secrets are retrieved from keytar and restored via Electron's safeStorage API. In the future, we will remove this migration so that we can remove our dependency on keytar altogether.
keytar deprecation plan
For a while now, VS Code has had a large dependency on keytar, an abstraction layer used to store secrets in the OS keyring. Additionally, we have included a keytar shim in VS Code that extensions depended on before the introduction of the SecretStorage API. keytar itself is officially archived and not being maintained... In an effort to promote good security practices by not depending on an archived piece of software for storing secrets, we are working on a plan to remove this shim from VS Code.
We have already directly reached out to extension authors of popular extensions that still use this keytar shim and they are working on moving off of it. We want to communicate this here as well as in our GitHub Discussions for those we didn't contact directly so we minimize the disruption due to this change. We know this isn't the best news as we had a fair amount of work to remove our dependency on keytar as well, but we believe this is the right thing to do to ensure extensions are using secure APIs.
If you are using keytar directly in your extension, there are a couple of options for you to consider:
- (recommended) Use the SecretStorage API that VS Code provides on the ExtensionContext. This API is cross-platform and works on all platforms that VS Code supports. It is also maintained by the VS Code team, will continue to be maintained, and has been a part of the VS Code API for years.
- (not recommended) You can bundle the keytar module with your extension. Keep in mind that keytar is a native node module, which means that you will need to publish a platform specific extension for each platform you want to support.
Timeline: The current plan is to remove this shim from VS Code Insiders in early August, which means that September 2023's stable release will be the first release without the shim.
Work for this is being tracked in issue #115215 and if you have any questions, feel free to ask them here in our GitHub Discussions.
Improved vscode.fs.writeFile performance for local files
When you are using vscode.fs.writeFile API to write data into files (you should!), write operations to files that are local to the extension host will now resolve much faster.
Previously the extension host would delegate the write operation to the VS Code client for execution, but now the operation executes directly inside the extension host, saving round trips.
Tree checkbox API
The TreeItem checkboxState API has been finalized. By default, tree items that have checkboxes will have their checked state managed by VS Code. This behavior can be changed by setting the TreeViewOptions property manageCheckboxStateManually to true. When manageCheckboxStateManually is set, the extension is responsible for managing checking and unchecking of parent and child checkboxes.
EnvironmentVariableCollection.description
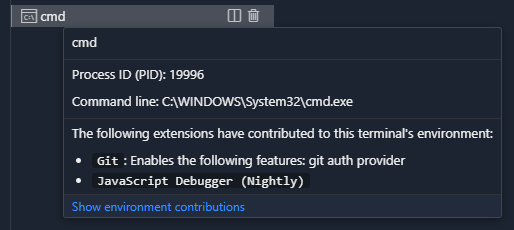
This new API allows specifying a description for EnvironmentVariableCollection, displayed to the user in the terminal tab hover, to explain what exactly the change is doing.
// Example of what the Git extension could use
context.environmentVariableCollection.description =
  'An explanation of what the environment changes do';
You can see the API in action in the built-in Git extension, which now describes what the change does:
Proposed APIs
Every milestone comes with new proposed APIs and extension authors can try them out. As always, we want your feedback. Here are the steps to try out a proposed API:
- Find a proposal that you want to try and add its name to
package.json#enabledApiProposals. - Use the latest @vscode/dts and run
npx @vscode/dts dev. It will download the correspondingd.tsfiles into your workspace. - You can now program against the proposal.
You cannot publish an extension that uses a proposed API. There may be breaking changes in the next release and we never want to break existing extensions.
Read-only message for file system providers
When you registerFileSystemProvider, you can provide a read-only message instead of simply marking a file system as read-only. The message below is displayed in the editor when a user tries to edit a file from that provider.

Engineering
Name mangling of exported symbols
Last year we started mangling the names of private properties and methods to reduce our code size. We now also mangle exported symbol names, which reduces the size of our main workbench JavaScript file a further 8%.
Our name mangling build step now saves a total of 3.9 MB of JavaScript across core VS Code and our built-in extensions. This reduction speeds up downloads, reduces VS Code's install size, and speeds up code loading every time you start VS Code.
Checksum integrity checks for Node.js, built-in extensions, and Electron
As part of our build, we consume binary resources from other locations, such as Node.js for our remote server and built-in extensions from the Marketplace and Electron. This milestone, we ensure the integrity of these binary resources by validating against a SHA256 checksum that is checked into the vscode GitHub repository.
New Linux performance machine
We take the performance of VS Code very seriously, especially the elapsed time it takes to open a text editor and see a blinking cursor. To monitor that elapsed time, we run daily performance tests on Windows and macOS.
This milestone, we added a Linux machine to the test set, reporting the startup times on Ubuntu 22.

Event emitter optimizations
VS Code uses event emitters extensively throughout our codebase. We've optimized these emitters this iteration, which slightly improved startup time and memory usage.
You can read more about this improvement in issue #185789.
Terminal pty host improvements
The "Pty Host" process manages all shell processes launched by the terminal and several improvements were made:
- Performance
- There is now a direct channel of communication to the pty host process. The most significant change from this is the reduction of input latency of the terminal.
- Reconnection (reload window) and process revival (restart) performance has been improved by reducing unneeded calls and parallelizing tasks when there are multiple terminals being restored.
- We now gather performance metrics on terminal startup and reconnection, which can be viewed via the Developer: Startup Performance command.
- Diagnostics
- All terminal-related logs have moved out of the Window output channel and into the new Terminal output channel.
- When trace log level is on the Pty Host output channel, the terminal will log all RPC calls, which will help in diagnosing terminal problems.
Documentation
New C# topics
You can learn about C# development in VS Code with the C# Dev Kit extension through a new set of C# articles. There you'll find topics explaining how to get started, describing the extension's language features (code navigation, refactoring, debugging), and aiding the development life cycle such as Project and Package management.
Glob patterns reference
VS Code has it's own glob pattern implementation, which it uses for features like Search file and folder filtering, letting you customize the File Explorer view, etc. To learn the details, you can review the new Glob Patterns Reference.
Notable fixes
- Loses text when maximizing the integrated terminal #134448
- Support fish shell integration automatic injection #139400
Thank you
Last but certainly not least, a big Thank You to the contributors of VS Code.
Issue tracking
Contributions to our issue tracking:
- @gjsjohnmurray (John Murray)
- @starball5 (starball)
- @IllusionMH (Andrii Dieiev)
- @ArturoDent (ArturoDent)
Pull requests
Contributions to vscode:
- @AlbertHilb: Add
macrosentry to markdown-math configuration PR #180458 - @antonioprudenzano (Antonio Prudenzano): Feat: #132598 Add notification in case of running a translated build on windows and macOS PR #181191
- @cadinsl: Edited user and workspace tab to only display the name for accessibility #184530 PR #184627
- @CGNonofr (Loïc Mangeonjean): Remove side effect from
array.somecallback PR #184919 - @ChaseKnowlden: chore: update minimum installable version in inno setup PR #175818
- @cmtm (Chris Morin): Respect gitignore file even when not in a git repository PR #183368
- @gjsjohnmurray (John Murray)
- Implement
files.dialog.defaultPathsetting (fix #115730) PR #182908 - Display terminal icon correctly in panel titlebar (fix #183679) PR #183680
- Allow downloads from pages viewed in Simple Browser PR #185117
- Implement
- @hermannloose (Hermann Loose): Fix color definition for Comments panel tree view icons PR #185654
- @hsfzxjy: Fix #185858: Add option to enable/disable editor group maximization on double clicking tab title PR #185966
- @iifawzi (Fawzi Abdulfattah): feat: adding optional support for auto playing and looping videos PR #184758
- @InigoMoreno (Iñigo Moreno): Update argv.ts to allow empty category PR #181311
- @jacekkopecky (Jacek Kopecký): Add tabSizingFixedMinWidth setting (#_185766) PR #186058
- @jeanp413 (Jean Pierre)
- Fix
remote.autoForwardPortsSourcesometimes not respected from machine settings PR #184860 - Fix xterm search addon is loaded twice in vscode in browser PR #184922
- Fix
- @jhunt-scottlogic (Joshua Hunt): Test Explorer filter UI PR #183192
- @jjaeggli (Jacob Jaeggli): Add dialog role to editor find widget PR #172979
- @joshaber (Josh Abernathy): Fix removing tunnels when the tunnel factory throws an error PR #186566
- @kevalmiistry (Keval Mistry): FIX: conflict actions bar overlapping Complete Merge button fixed PR #184603
- @max06 (Flo): Restore ShellIntegration for fish (#_184659) PR #184739
- @r3m0t (Tomer Chachamu): Add vscode-context-menu-visible class in webviews PR #181433
- @russelldavis (Russell Davis): Add option for smartSelect to ignore subwords PR #182571
- @tisilent (xie jialong 努力鸭): update gutterOffsetX range (dirtydiff , fold) PR #184339
- @weartist (Hans)
- adjust to correct link PR #184011
- Fix #182013 PR #184677
- Fix #185051 PR #185431
- Fix #153590 PR #185467
- Fix:#185359 PR #185718
- @yshaojun
- fix: cursor not visible at column 1 in mergeEditor(#_183736) PR #184604
- fix: inline completion not displaying(#_184108) PR #185215
Contributions to vscode-emmet-helper:
- @iifawzi (Fawzi Abdulfattah): fix: mark successive dots as noise and invalidate jinja syntax abbreviations PR #80
Contributions to vscode-livepreview:
- @toyobayashi (Toyo Li): fix console line number in external browser PR #503
Contributions to vscode-pull-request-github:
- @SKPG-Tech (Salvijus K.): Fix null when no user name available PR #4892