March 2024 (version 1.88)
Update 1.88.1: The update addresses these issues.
Downloads: Windows: x64 Arm64 | Mac: Universal Intel silicon | Linux: deb rpm tarball Arm snap
Welcome to the March 2024 release of Visual Studio Code. There are many updates in this version that we hope you'll like, some of the key highlights include:
- Apply custom editor labels - Distinguish between editors with same file names.
- Locked scrolling - Compare editors side-by-side with synchronized scrolling.
- Extension update improvements - Restart extensions without reload & update extensions with VS Code releases.
- Test Coverage API - Native code coverage support in VS Code.
- Folding markers in minimap - Easily identify and navigate to code sections from minimap.
- Quick Search improvements - Sticky file path separators and separator buttons.
- Notebook Run cells in section - Quickly run all cells in a notebook section.
- Copilot improvements - Improved inline chat UI, commit messages, and used references.
- Python auto-detect improvements - Detect startup files for Flask & Django, discover Hatch environments.
- Preview: Terminal inline chat - Start a Copilot inline chat conversation directly from the terminal.
If you'd like to read these release notes online, go to Updates on code.visualstudio.com. Insiders: Want to try new features as soon as possible? You can download the nightly Insiders build and try the latest updates as soon as they are available.
Accessibility
Voice recording sounds
We have added new accessibility signal sounds for voice recording:
- Voice recording start - configured with the
accessibility.signals.voiceRecordingStartedsetting - Voice recording end - configured with the
accessibility.signals.voiceRecordingStoppedsetting
Improved diff editor accessibility
If you're using a screen reader, you now get an announcement when a diff editor becomes the active editor. You can disable this behavior with the accessibility.verbosity.diffEditorActive setting.
We also added information about Diff Editor: Switch Side, a helpful command for keyboard users, to the accessibility help dialog.
Accessibility Signals now work on both sides of the diff editor. Previously, they were only available on the modified side.
Accessible View chat code block commands
When you inspect a chat response in the Accessible View, you can now use the code block commands and keybindings that are available in the Chat view.
These include Chat: Insert at Cursor, Chat: Insert into Terminal and Chat: Insert into New File.
Notebook cell aria label updates
Aria labels for notebook cells now update to indicate if the cell is currently executing or pending execution.
Workbench
Custom editor support in floating windows
We expanded support for opening editors into floating windows to custom editors, and generally all editors that use the webview API. This includes markdown preview, browser preview, and complex custom editors, such as our hex editor.
Note: due to a technical limitation, moving a webview-based editor between windows requires the contents of that editor to reload. It is then up to the editor to restore the state you had previously accumulated. In some cases your state might be reset, as if you had opened the editor for the first time.
Custom labels for open editors
We now let you customize the display label for editor tabs and the Open editors view. This functionality can be useful to distinguish between editors for files with the same name.
You can tailor these labels to your preference by adding entries under the workbench.editor.customLabels.patterns setting. Each entry should include a glob pattern that matches file paths and a template that defines the new name for the editor tab. This customization only applies when a file's path matches the specified pattern. Whether a pattern matches, depends on if it's defined as a relative or absolute file path pattern.
Templates can incorporate variables such as ${filename}, ${extname}, ${dirname}, and ${dirname(N)}, which are dynamically replaced with values from the file's path.
To enable or disable these custom labels, use the workbench.editor.customLabels.enabled setting. This enables you to switch to the original editor names at any time, without having to remove your custom patterns.
Locked scrolling
You can now synchronize scrolling across all visible editors by using the View: Toggle Locked Scrolling Across Editors command. This means that when you scroll in one editor, all the other editors scroll by the same amount, keeping everything aligned. This feature can be useful if you need to compare files side-by-side.
If you want more control for enabling and disabling locked scrolling, you can choose to only activate the scrolling sync when you're holding down a specific keybinding. Set up a keyboard shortcut for the workbench.action.holdLockedScrolling command, and you're able to temporarily lock the scrolling across editors whenever you need it.
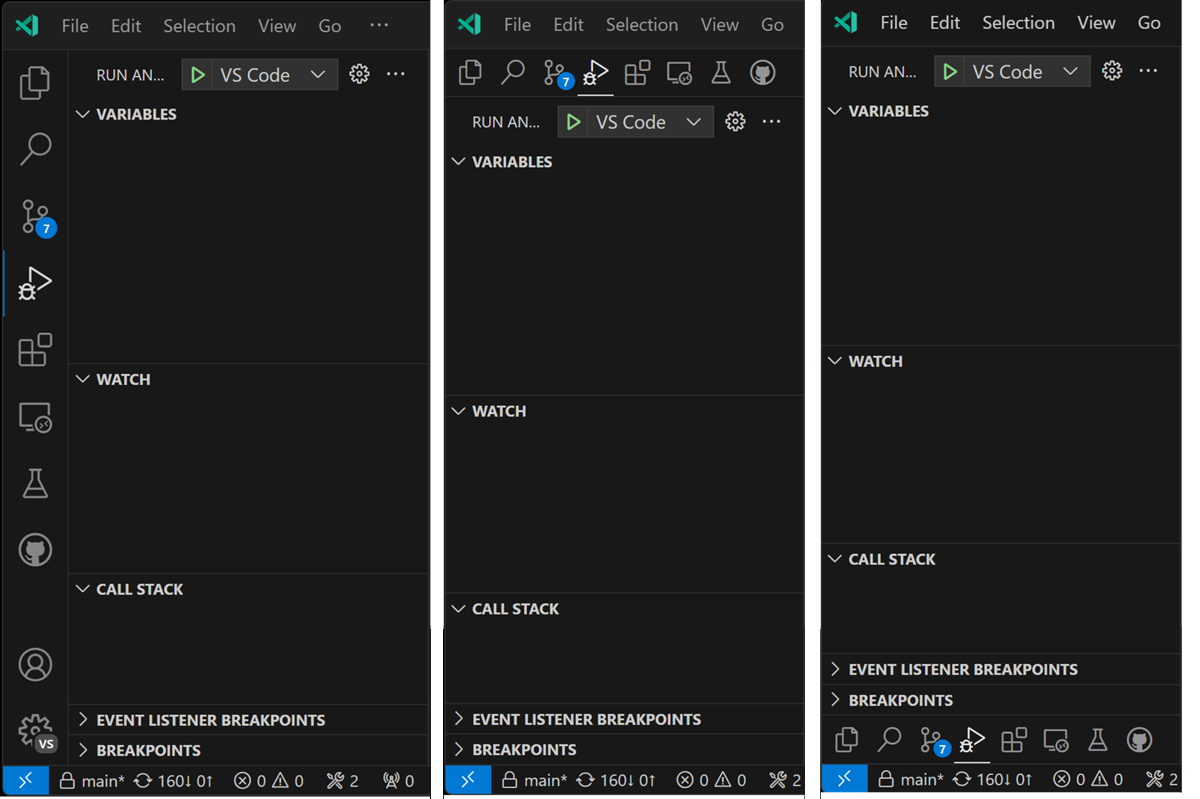
Activity Bar at the bottom
Previously, we introduced the option to move the Activity bar to the top of the Side Bar. We're now enabling you to also move the Activity Bar to the bottom. To do this, change the workbench.activityBar.location setting to bottom.
We've also improved the look and feel of the Activity Bar when it's positioned at the top, to make sure it fits in nicely with the rest of the interface.
Search Editor single-click behavior
You can now configure the search.searchEditor.singleClickBehaviour setting to determine what happens when you single-click on a Search Editor entry. Currently, the setting only supports opening a Peek Definition.
Quick Search improvements
Sticky file paths
In Quick Search, we've made the file name separators sticky to make it clearer which file a search result is associated with. This can be useful when you have many occurrences of a search term in a file.
File path separator buttons
When you hover over the file results of a particular file, or if you arrow down to a result, the buttons (for example, to open the file) also appear for the file path separator.
Quick Pick separator navigation keybindings
We received feedback that it would be nice to be able to navigate between separators in a quick pick. This iteration, we've added a keybinding to do just this. On Windows & Linux, you can use Alt+Up/Down, and on macOS it is Cmd+Up/Down. In this example video, you can see the active item moving between:
- The
recently usedandother commandsseparators in the Command Palette - Between the file path separators in Quick Search
Quick Pick disabled checkbox items
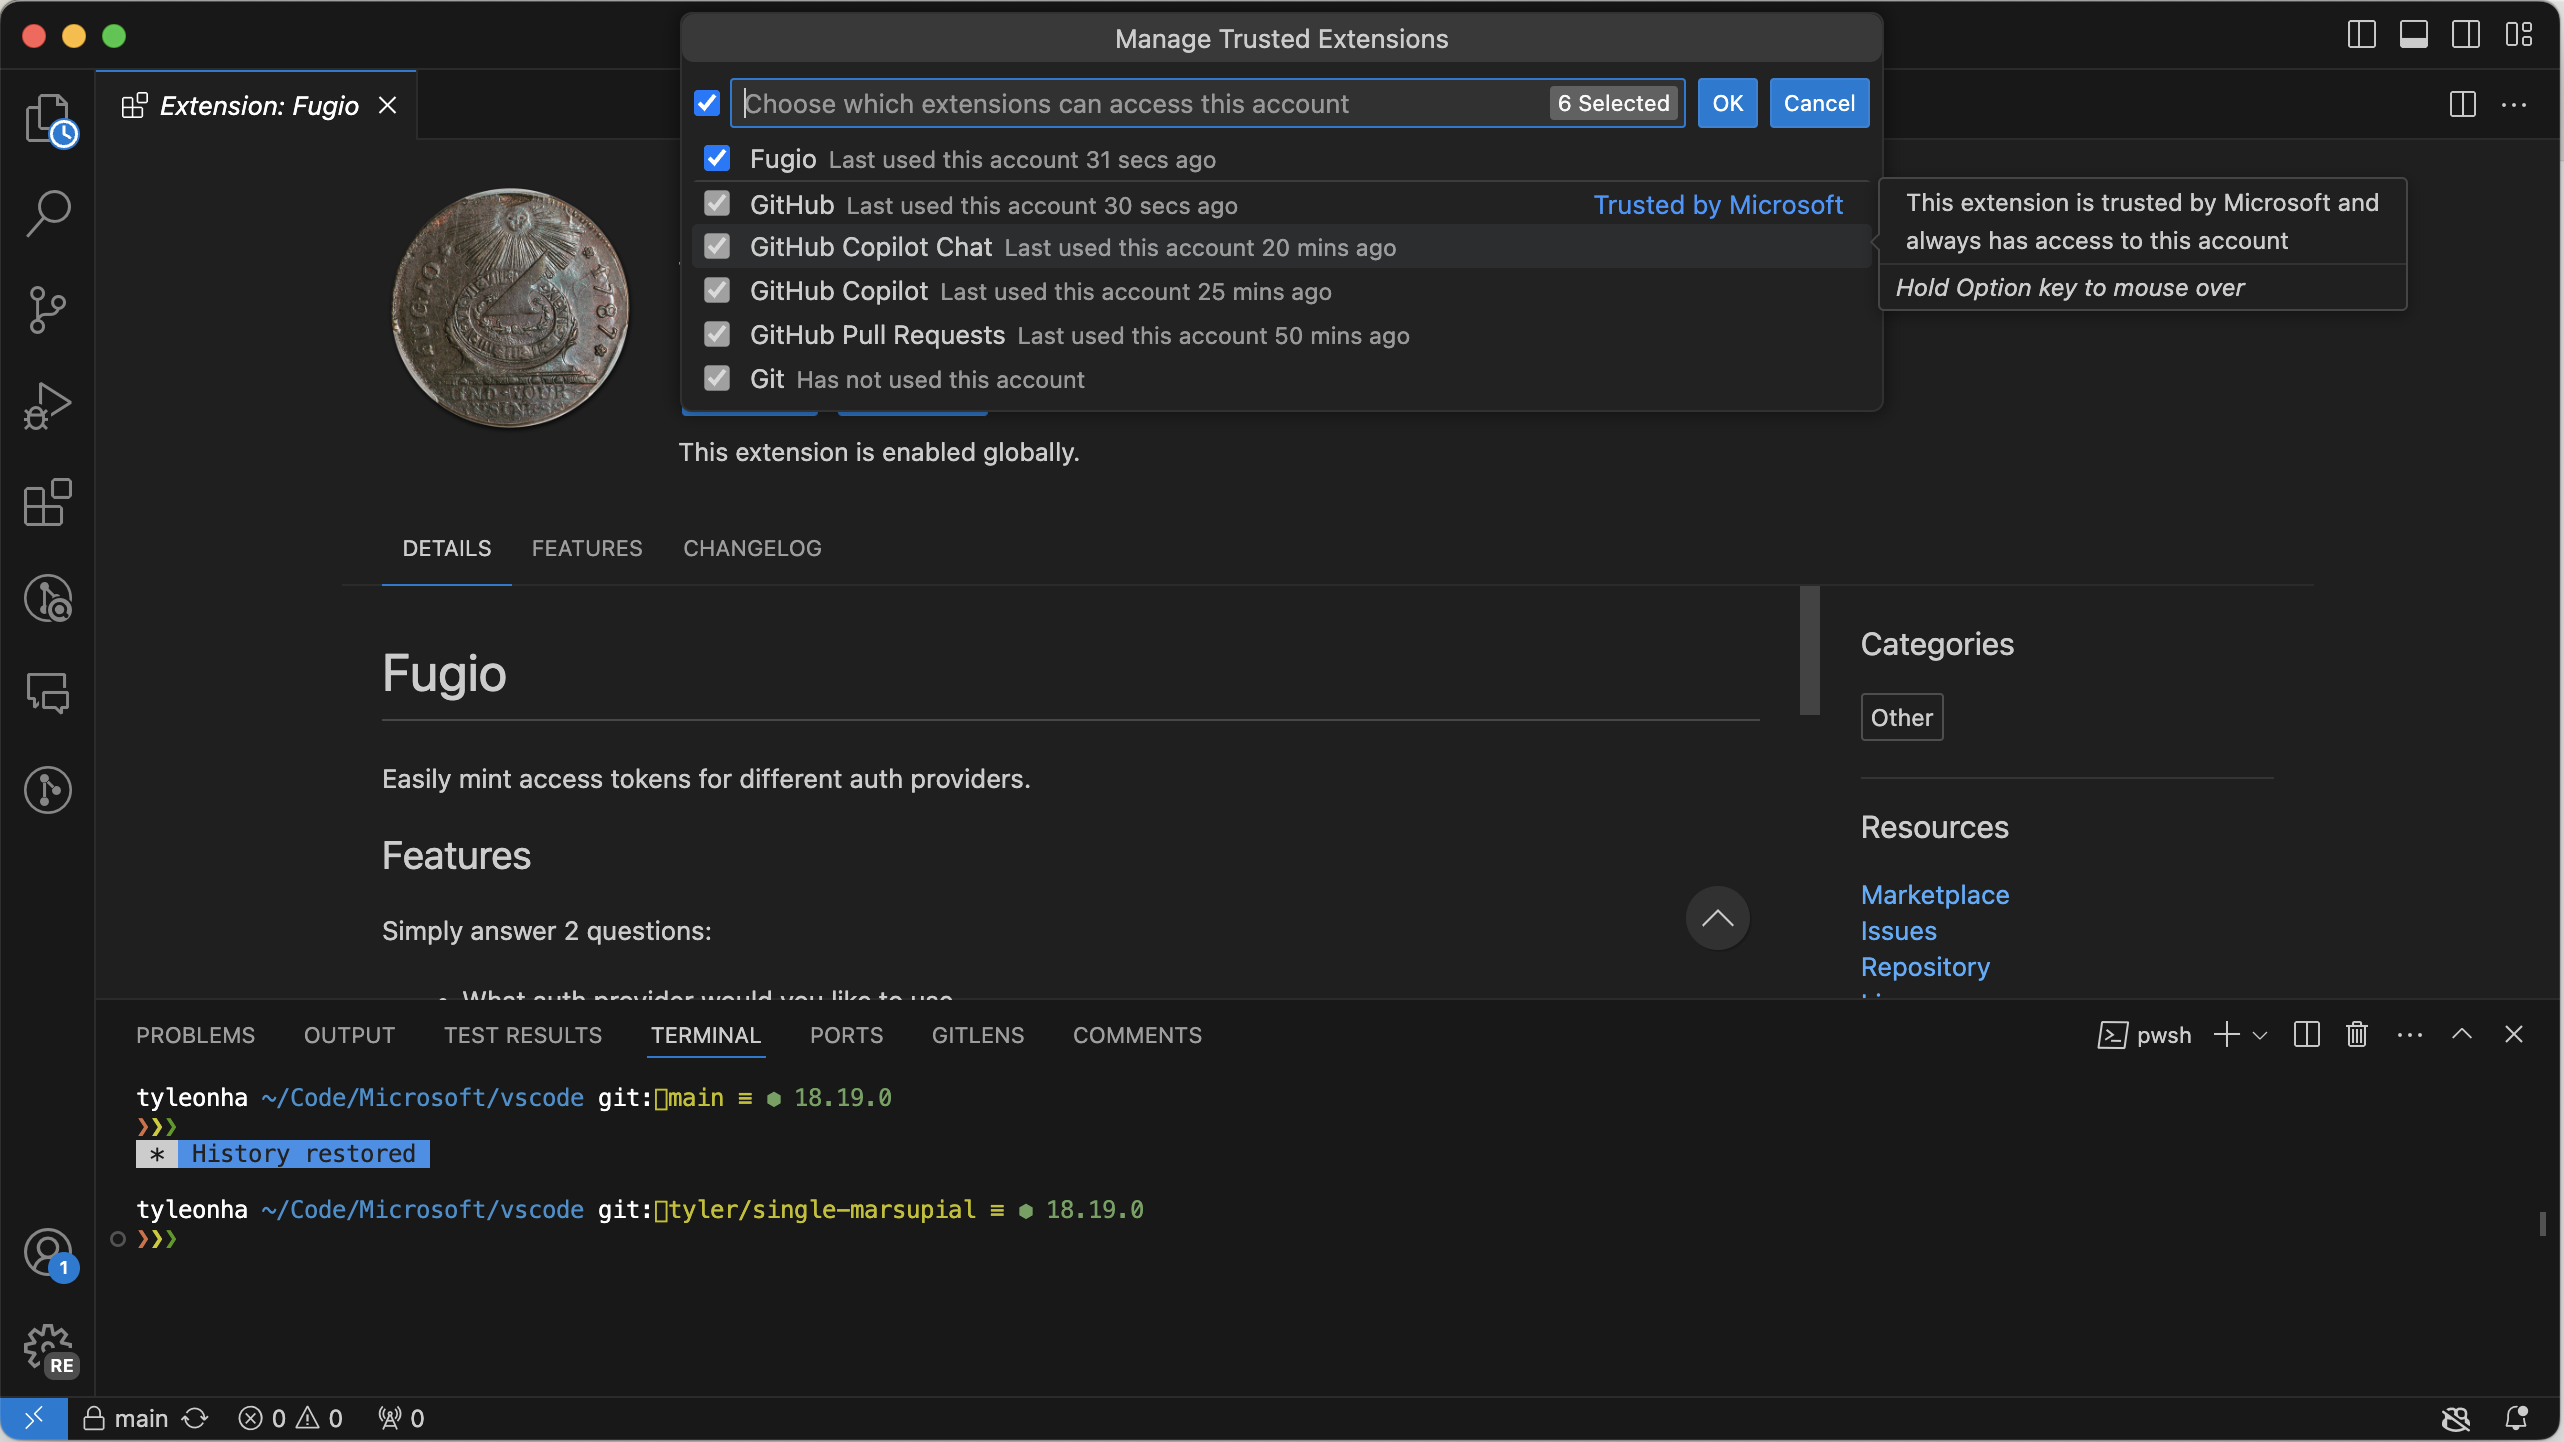
This iteration, we made it clearer when a quick pick displays items that are disabled. An example of this can be found in the "Manage Trusted Extensions" quick pick, which can be accessed for any of the accounts that you're logged in to.
Extensions update improvements
Restart extensions
When an extension is updated, you can now restart extensions instead of having to reload the window.
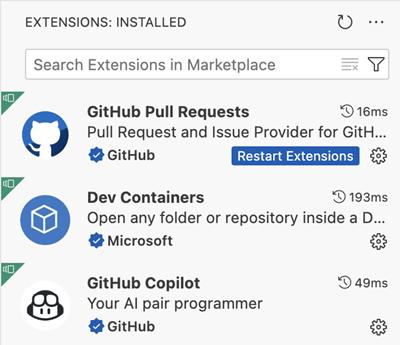
Note: When you are connected to a remote server like WSL or SSH or Dev Container, you still need to reload the window to update extensions.
Update extensions with VS Code updates
When you have extensions auto update enabled, VS Code now updates the extensions that are compatible with the newer version of VS Code that is available for update. If the newer version of the extension is not compatible with the current version of VS Code, then the newer version of the extension is enabled only after you update VS Code.
Jump to comment reply
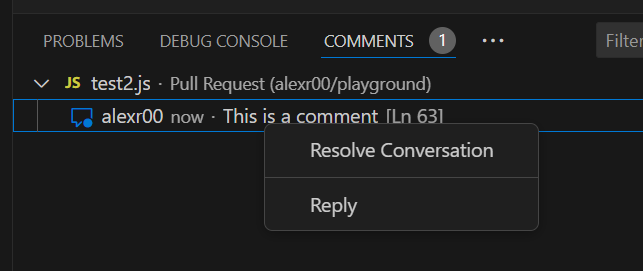
The context menu for a comment thread in the Comments view now includes a "Reply" action when the comment thread allows replies. This enables you to quickly jump to the reply input box and start typing a reply.
Editor
Minimap section headers
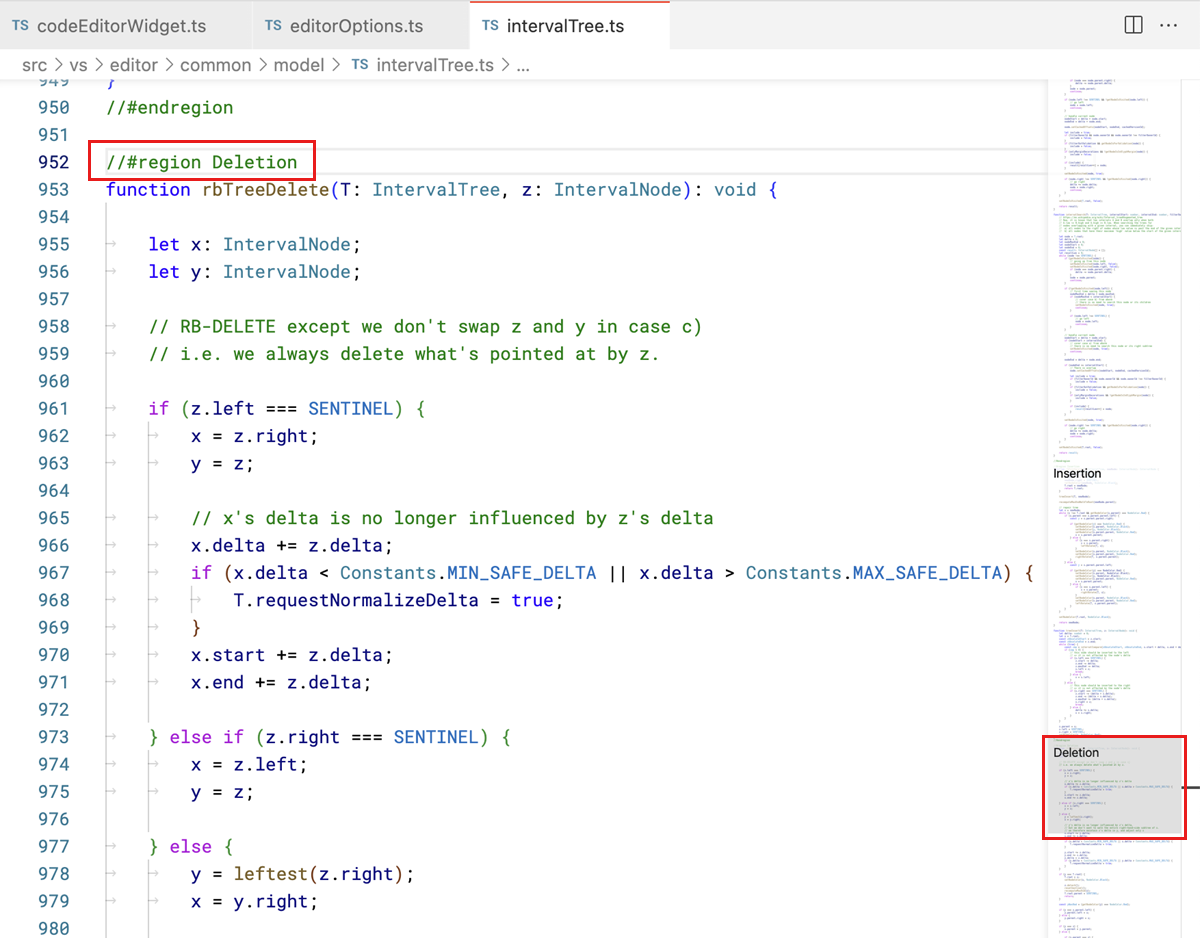
The minimap now recognizes and renders sections defined by folding markers, such as //#region in TypeScript, or comments that use MARK:. This lets you quickly scan and navigate across large files.
Refactor Preview keybindings
We updated the keybinding for previewing edits for the Rename Symbols refactoring (F2) to maintain consistency with previewing refactorings in other contexts, such as Code Actions. You can now preview edits by using ⌘Enter (Windows, Linux Ctrl+Enter) (previously Shift + Enter).
When hovering over a Code Actions, ⌘Enter (Windows, Linux Ctrl+Enter) also opens the Refactor Preview panel in the workbench.
Diff Editor Stage/Revert Selection Buttons
The diff editor now has a separate gutter for Stage and Revert controls. These actions enable you to stage or revert changed code blocks.
If you perform a text selection of some changes, these buttons let you stage or revert the selected changes (all changed characters within the selection).
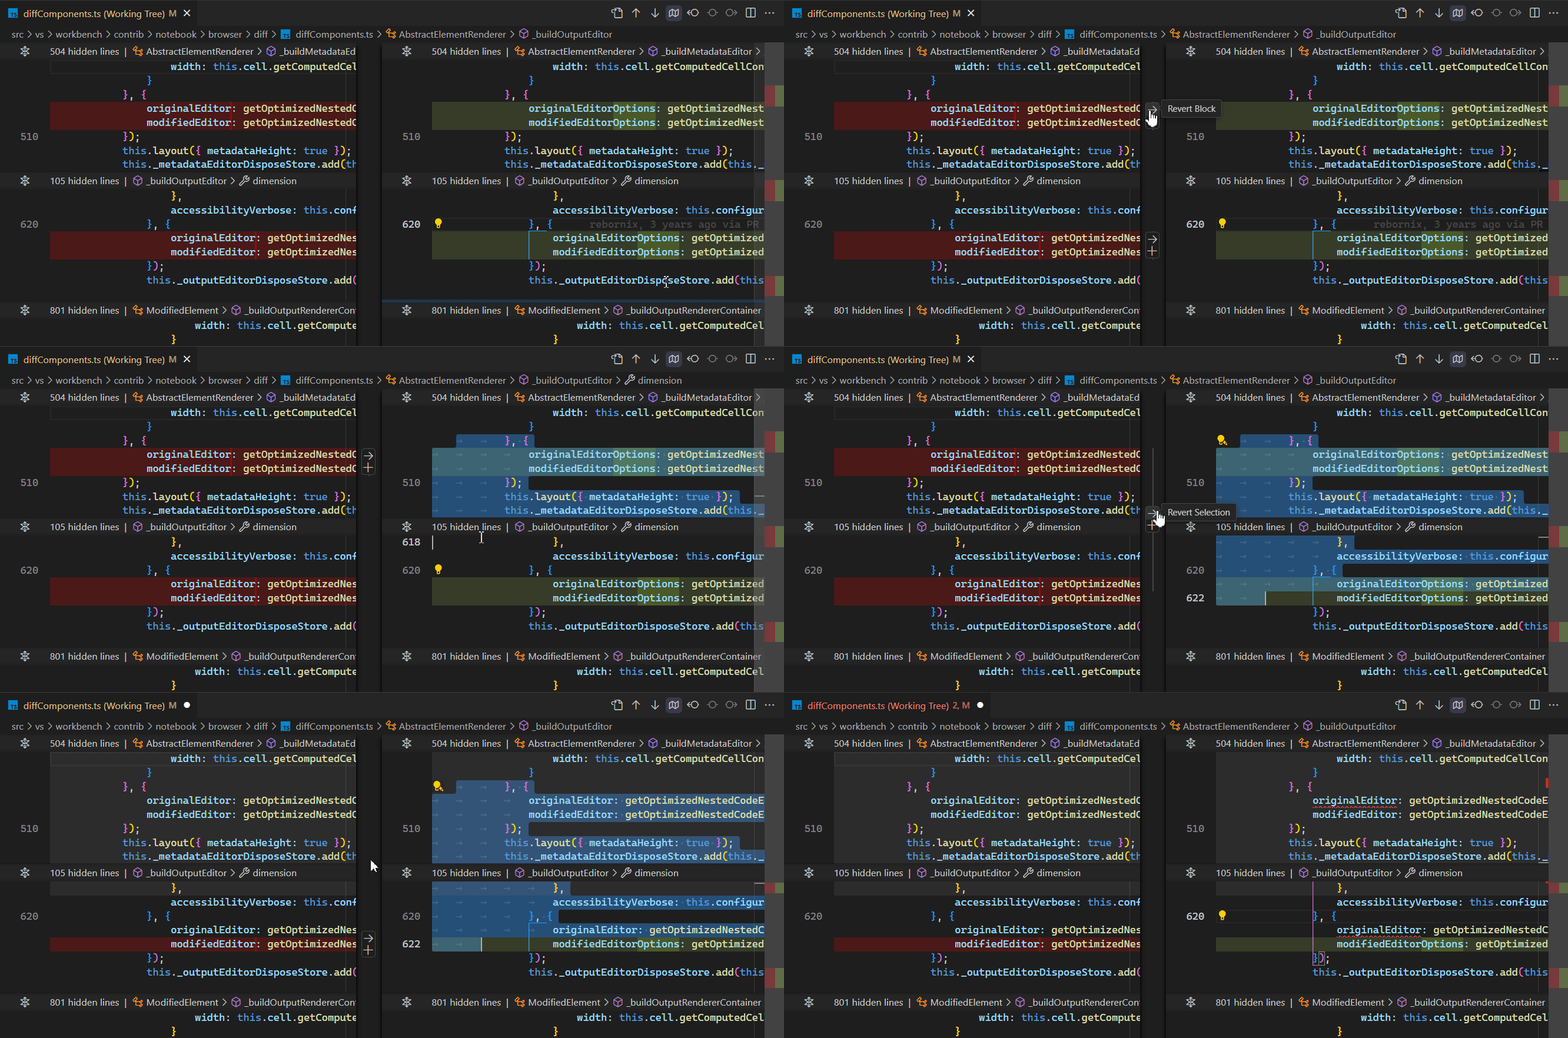
You can hide the diff editor gutter by setting diffEditor.renderGutterMenu to false.
Rename suggestions behavior
We improved the flow of using rename suggestions to match that of quick picks. When you select a rename suggestion from the list, the input value now updates accordingly, which enables you to further modify the suggestion.

Source Control
Incoming changes file decorations
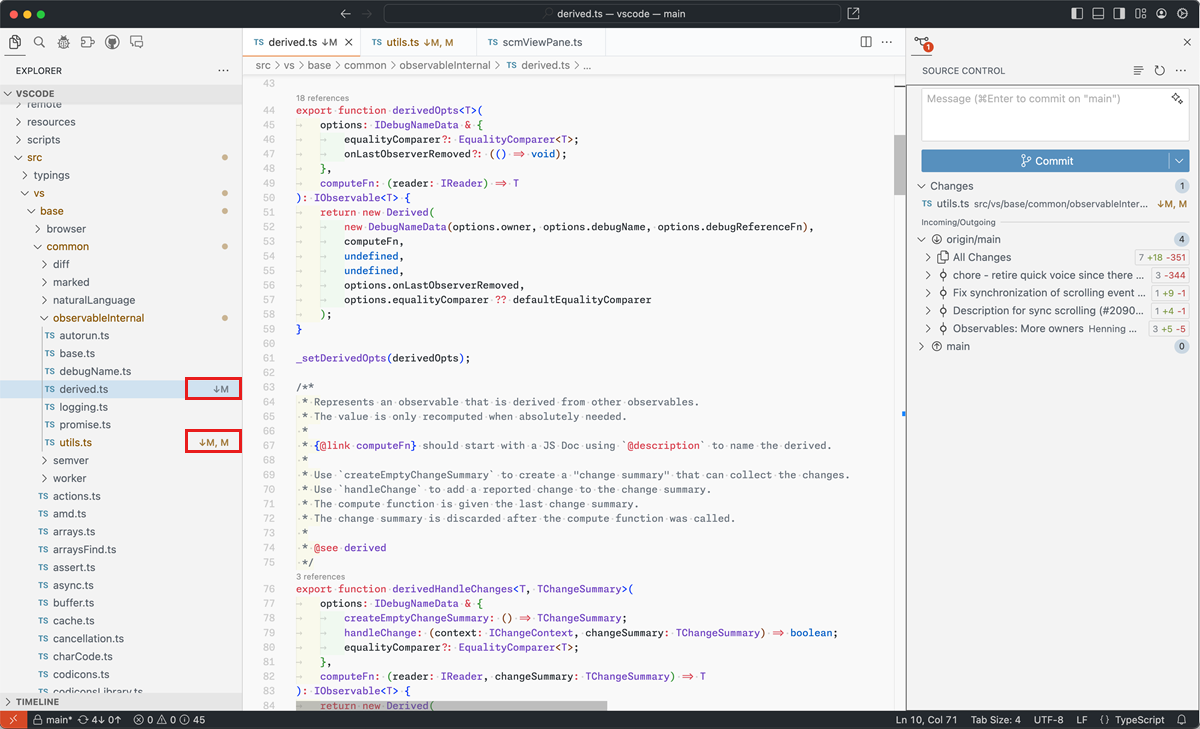
To help avoid potential conflicts when merging/rebasing changes from the remote, we now show file decorations for all files that have incoming changes and which were fetched but not yet merged/rebased. To benefit from this functionality, you should have both git.autofetch and git.decorations.enabled settings enabled.
Theme: GitHub Sharp (preview on vscode.dev)
Terminal
Shell integration in debug terminals
To provide enhanced functionality to the user and extensions, shell integration is now automatically enabled in terminals that are launched when debugging.
Run recent command improvements
The shell integration-powered Run recent command (⌃⌥R (Windows, Linux Ctrl+Alt+R)) now scrolls to and displays the last time the command was run, where possible. Running the command or canceling the quick pick returns the terminal to its previous state.
Theme: Sapphire (preview on vscode.dev)
Open detected link improvements
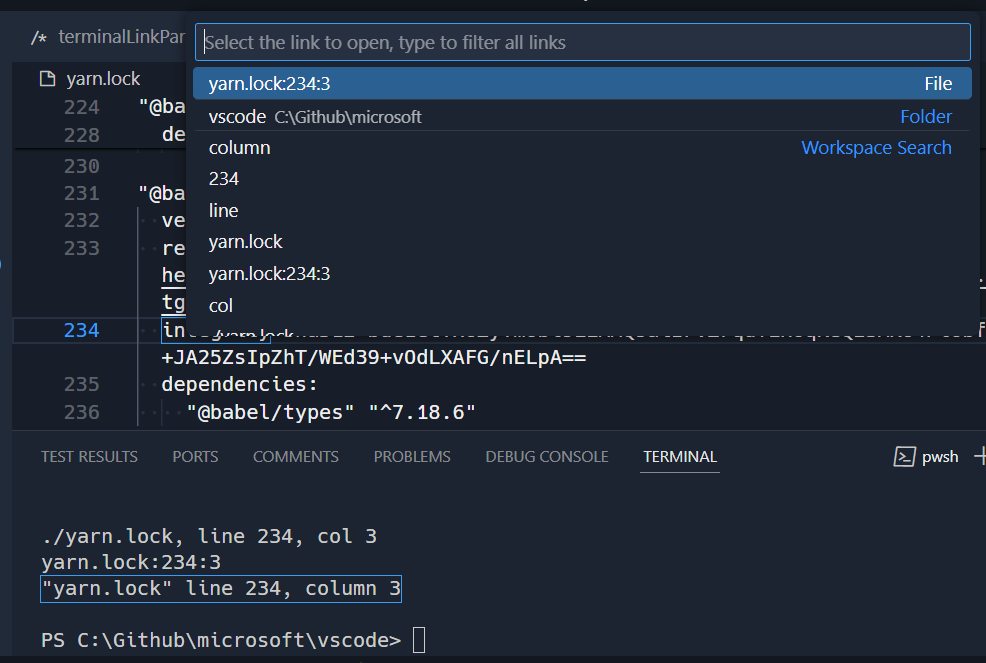
The Open detected link command (⇧⌘G (Windows, Linux Ctrl+Shift+G)) now previews the link result in the editor and highlights the link source in the terminal.
Additionally, duplicate links are now filtered out of the list and all links are presented in a consistent format.
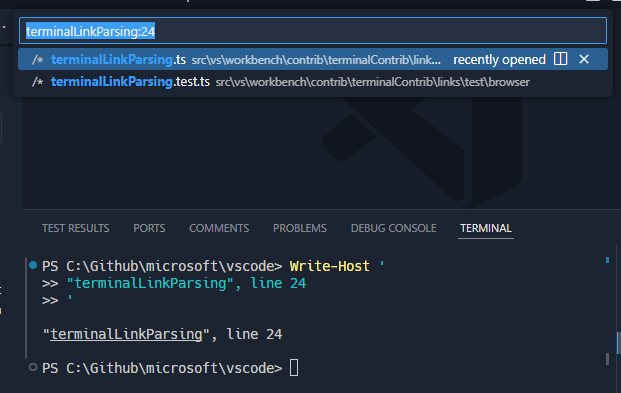
Additional context for word links
Word links are defined by the terminal.integrated.wordSeparators setting and are the fallback when files/folder/URIs can't be found. When activated, these links now include extra surrounding context to add line and column information for the search that occurs.
Notice in the screenshot that the link terminalLinkParsing was selected, but the resulting search also includes the line number following the link.
New link formats
The following link format is now detected in terminals, even if the path contains spaces:
FILE path:line:column
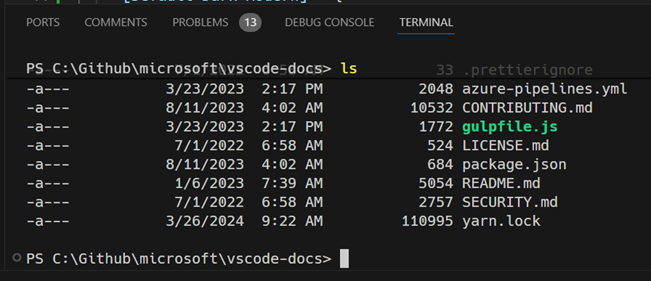
Terminal Sticky Scroll transparency support
Sticky Scroll in the terminal now supports transparency. A theme can use this by configuring the terminalStickyScroll.background theme color to a transparent value, or by specifying an override in your settings.json. For example:
{
  "workbench.colorCustomizations": {
    "[Default Dark Modern]": {
      "terminalStickyScroll.background": "#181818c0"
    }
  }
}
Which results in a transparent Sticky Scroll background, allowing the text behind to shine through:
Testing
Test Coverage
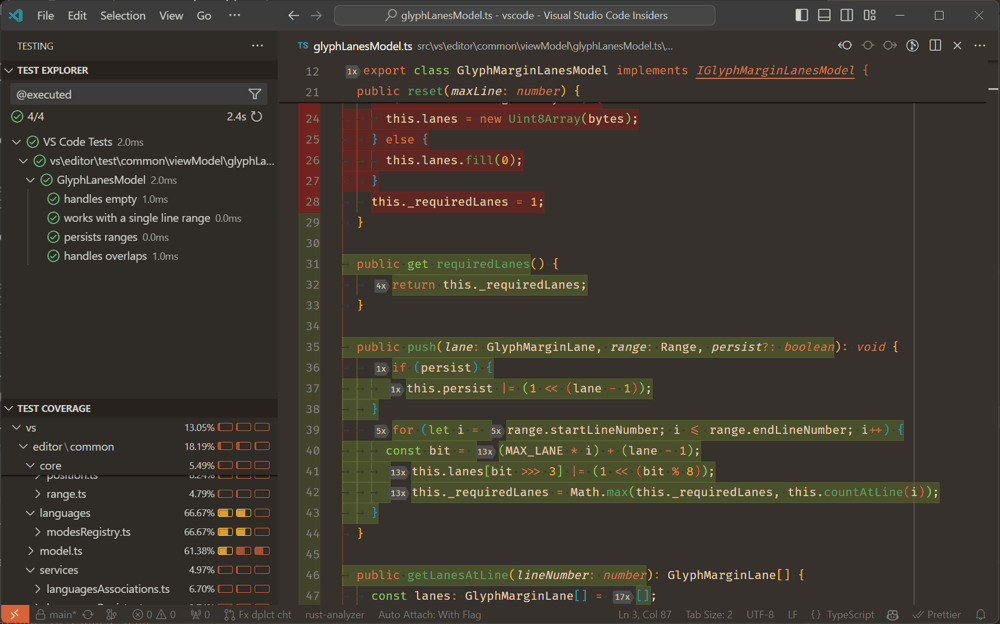
This iteration, we've finalized our Test Coverage API, bringing native coverage support to VS Code. If your testing system supports it, you can get coverage by using the new Run With Coverage button:

There are similarly new keybindings for running with coverage, such as Ctrl+; Ctrl+Shift+A to run all tests with coverage, and Ctrl+; Ctrl+Shift+L to run your last set of tests with coverage.
Coverage information is shown as an overlay on line numbers by default, but you can Toggle Inline Coverage to see complete detailed information for your source files:
Theme: Codesong (preview on vscode.dev)
Using test coverage requires that your extension implements the new API. Some extensions, such as the Test Runner for Java and the node:test runner already support it. Learn more about the Test Coverage for Java in the team's December and January updates.
Extension authors can find more details about the Test Coverage API in the Testing API documentation.
Color code support in test messages
We now parse terminal color codes to colorize textual test messages, such as those displayed when a test fails, rather than displaying the raw 'unprintable' data codes.
Languages
TypeScript 5.4
VS Code now includes TypeScript 5.4. This major update brings new improvements to type-checking and IntelliSense, and several bug fixes. See the TypeScript 5.4 release blog post for more details.
Smarter inserting of images and links in Markdown
When you drop or paste an image or file into a Markdown file, VS Code automatically inserts Markdown image or link syntax for it. We now also smartly disable this behavior when you insert into code blocks and other contexts that don't support Markdown syntax:
You can always switch back to inserting the Markdown syntax by using the drop/paste widget. You can configure this behavior by using the markdown.editor.drop.enabled and markdown.editor.filePaste.enabled settings.
Notebooks
Keyboard shortcuts in Notebook outputs
We now support some of the standard keyboard shortcuts in notebook outputs:
- Output can be selected and copied with the keyboard with the Ctrl+A and Ctrl+C keybindings respectively.
- Scrollable outputs can be scrolled with the keyboard with the Up and Down keybindings respectively.
- Scrolling to the top and bottom of a scrollable output can be achieved with the keyboard with the Ctrl+Home and Ctrl+End keybindings respectively (Cmd+Up and Cmd+Down on macOS).
- Selecting output from the current selection point to the top or bottom of the output, can be achieved with the keyboard with the Ctrl+Shift+Up and Ctrl+Shift+End keybindings respectively (Shift+Cmd+Up and Shift+Cmd+Down on macOS).
Cell error diagnostics
An extension can now provide error details for a failed cell, so that an error diagnostic shows within the cell. While focused on the cell container, notebook.cell.openFailureActions (⌘. (Windows, Linux Ctrl+.)) jumps to the quick actions menu for that error. The diagnostic only shows when a language model is available to provide quick actions.
Run cells in section
To more easily run related cells in a notebook, you can now run cells that are grouped together by a markdown section header with the Run Cells in Section action. This action is available on the notebook Outline view and for Sticky Scroll elements.
Within Sticky Scroll elements, right-click the header of your choice, and run the section via the action in the context menu. Within the Outline view, select the toolbar icon that appears on hover or selection, and then run a single cell or a section of cells via the presented actions.
Filter support in Outline view
You now have filters available in the notebook Outline view, which enable you to control the inclusion of Markdown headers, Code Cells, and Code Cell Symbols. The filters correspond to the following settings:
notebook.outline.showMarkdownHeadersOnlynotebook.outline.showCodeCellsnotebook.outline.showCodeCellSymbols
Prompt to save Interactive Window on close
By enabling the interactiveWindow.promptToSaveOnClose setting, you are prompted to save the content in an Interactive Window when it is closed, to ensure that you don't lose any work. The only currently supported file format is .ipynb.
Remote Development
The Remote Development extensions, allow you to use a Dev Container, remote machine via SSH or Remote Tunnels, or the Windows Subsystem for Linux (WSL) as a full-featured development environment.
Highlights include:
- Alternate server download for distros with extended support
- Port forwarding based on URI query string
- Dev Containers extension automatically starts Docker
- Restrict access to Dev Tunnels and port forwarding via group policies
You can learn more about these features in the Remote Development release notes.
Contributions to extensions
VS Code Speech
Lazy activation
The VS Code Speech extension now only activates when voice-to-text services are requested in VS Code. This ensures that the extension is not negatively impacting the extension host startup time.
Use display language as default speech language
By default, the VS Code speech extension now uses the display language of VS Code as the speech language and selects the corresponding model, if that language is supported.
For the accessibility.voice.speechLanguage setting, auto is the new default.
GitHub Copilot
Inline Chat improvements
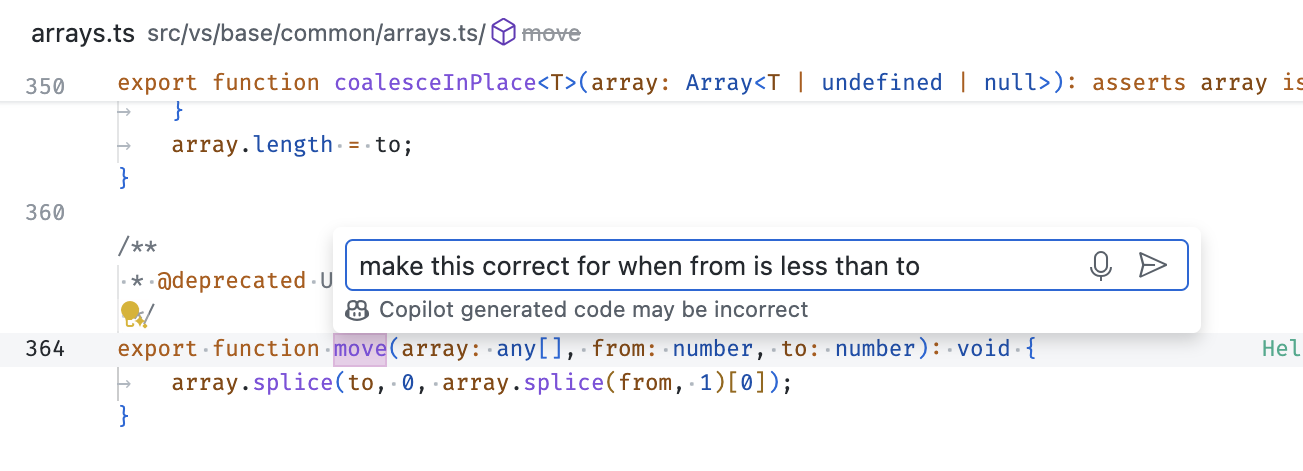
Inline Chat now starts as a floating control, making it more lightweight. After the first request, the control expands to take up more space. We have also adjusted the rendering to be more consistent with other chat experiences, such as the Chat view or Quick Chat.
 Theme: GitHub Light Colorblind (Beta)
We've repositioned the rerun and feedback controls, and made the toggle control for viewing diffs more prominent alongside the Accept and Discard buttons.
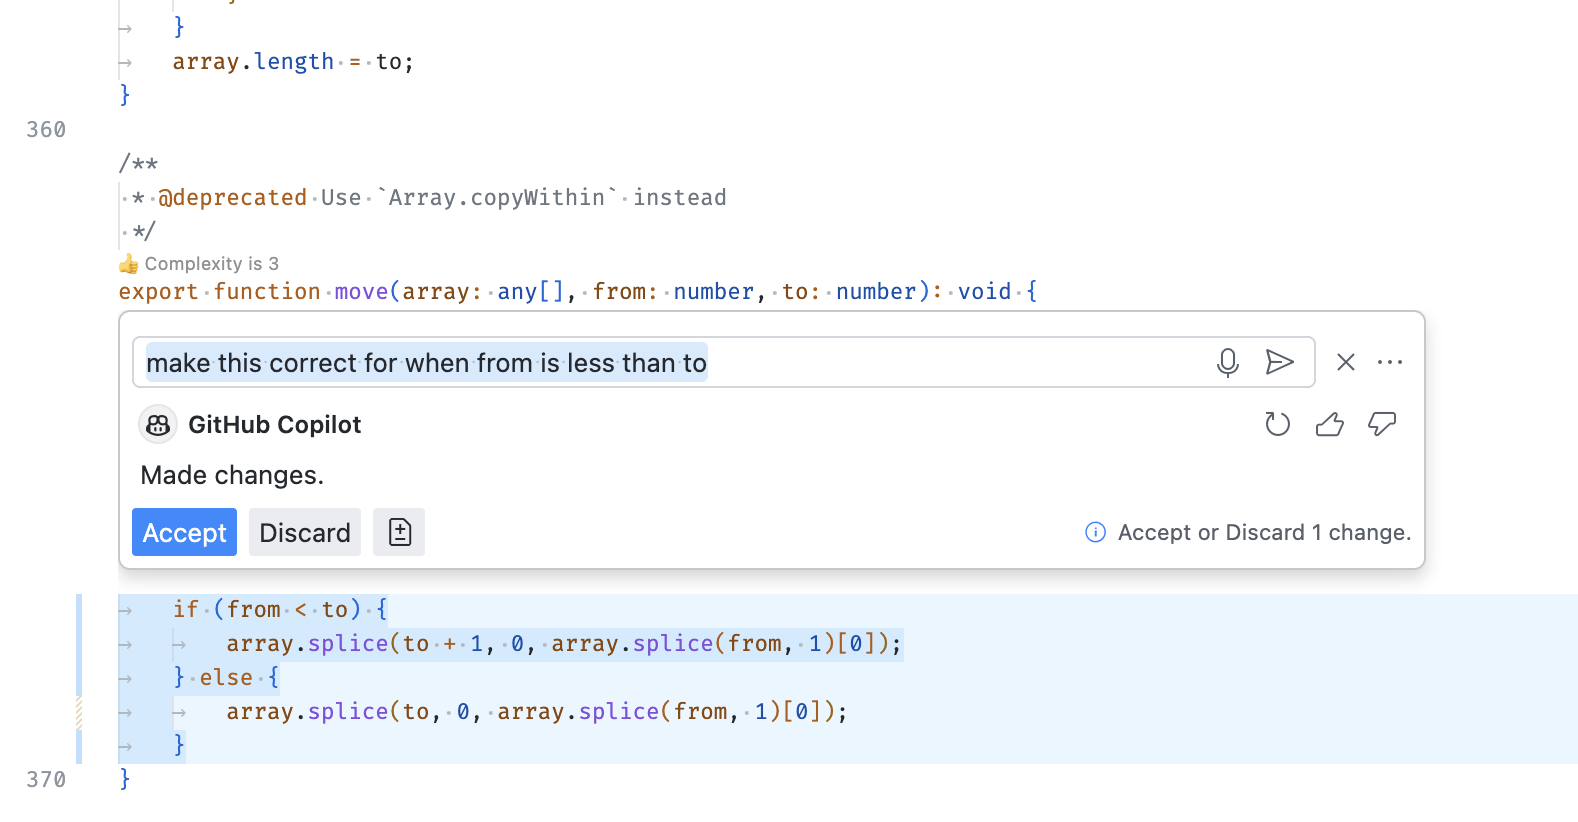 Theme: GitHub Light Colorblind (Beta)
Notebook kernel state as context
When you are in a notebook, the kernel state (for example, variables and available packages) is now automatically included as context in Inline Chat. This lets Copilot use the current state of the notebook to provide more relevant completions.
Theme: GitHub Dark
Commit message generation improvements
To improve the quality of the generated commit messages, we are now also including the commit messages of the 10 most recent commits in the repository, and the commit messages of the 10 most recent commits of the current user as extra context.
Workspace creation improvements
The @workspace /new command now offers sample projects, curated from GitHub repositories, as suggestions when a suitable match is detected for the chat prompt.
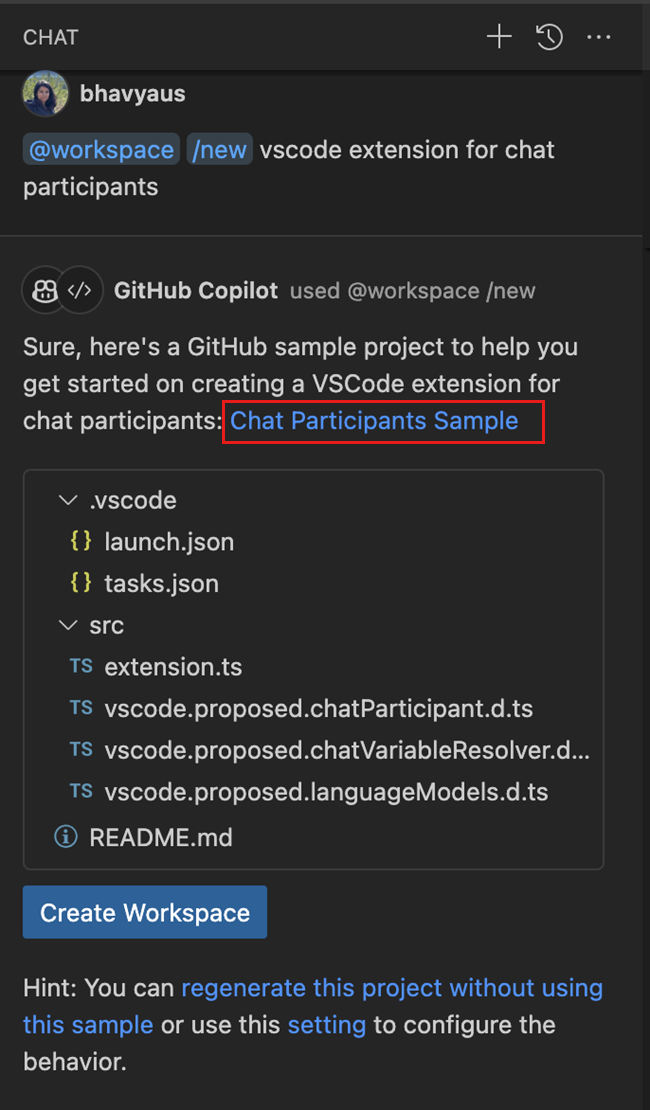
The @workspace /new command has also been enhanced to more effectively manage context and history. This enables you to refine suggested workspaces structure and file contents by asking follow-up queries. For example, "use TypeScript instead of JavaScript" or "also add bootstrap".
@terminal /explain slash command
A new @terminal /explain slash command is available, which is optimized for explaining commands or errors. Without /explain, @terminal is optimized to suggest a fix. This slash command is used in the Explain using Copilot quick fix or the Explain selection actions.
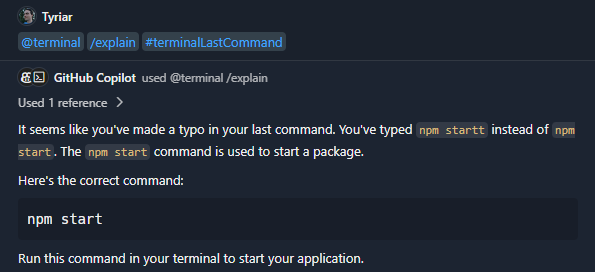
Preview: Terminal Inline Chat
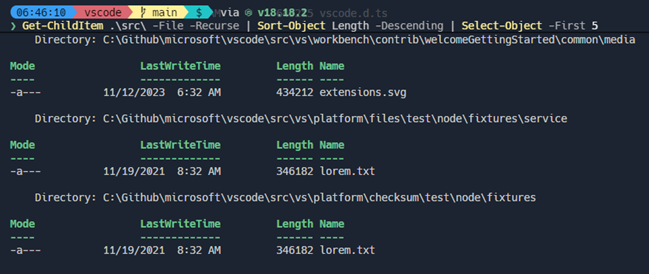
A preview of the terminal Inline Chat is available in this release, which gives convenient access to Copilot's capabilities directly in the terminal.
You can enable terminal Inline Chat with the terminal.integrated.experimentalInlineChat setting. To invoke the inline chat in a terminal, use the ⌘I (Windows, Linux Ctrl+I) keybinding.

The terminal Inline Chat uses the @terminal chat participant, which has context about the integrated terminal's shell and its contents.

Once a command is suggested, use ⌘Enter (Windows, Linux Ctrl+Enter) to run the command in the terminal or ⌥Enter (Windows, Linux Alt+Enter) to insert the command into the terminal. The command can also be edited directly in Copilot's response before running it (currently Ctrl+down, Tab, Tab on Windows & Linux, Cmd+down, Tab, Tab on macOS).
Clarity on authentication flow
Clarity around authentication is very important. We want to be clear about how we authenticate and what we ask for. If you open a private repository in VS Code, and we don't have the right authentication for this scenario, we present an authentication dialog. The dialog has a description of why authentication is needed, and a Learn more button to find out more about these requirements.
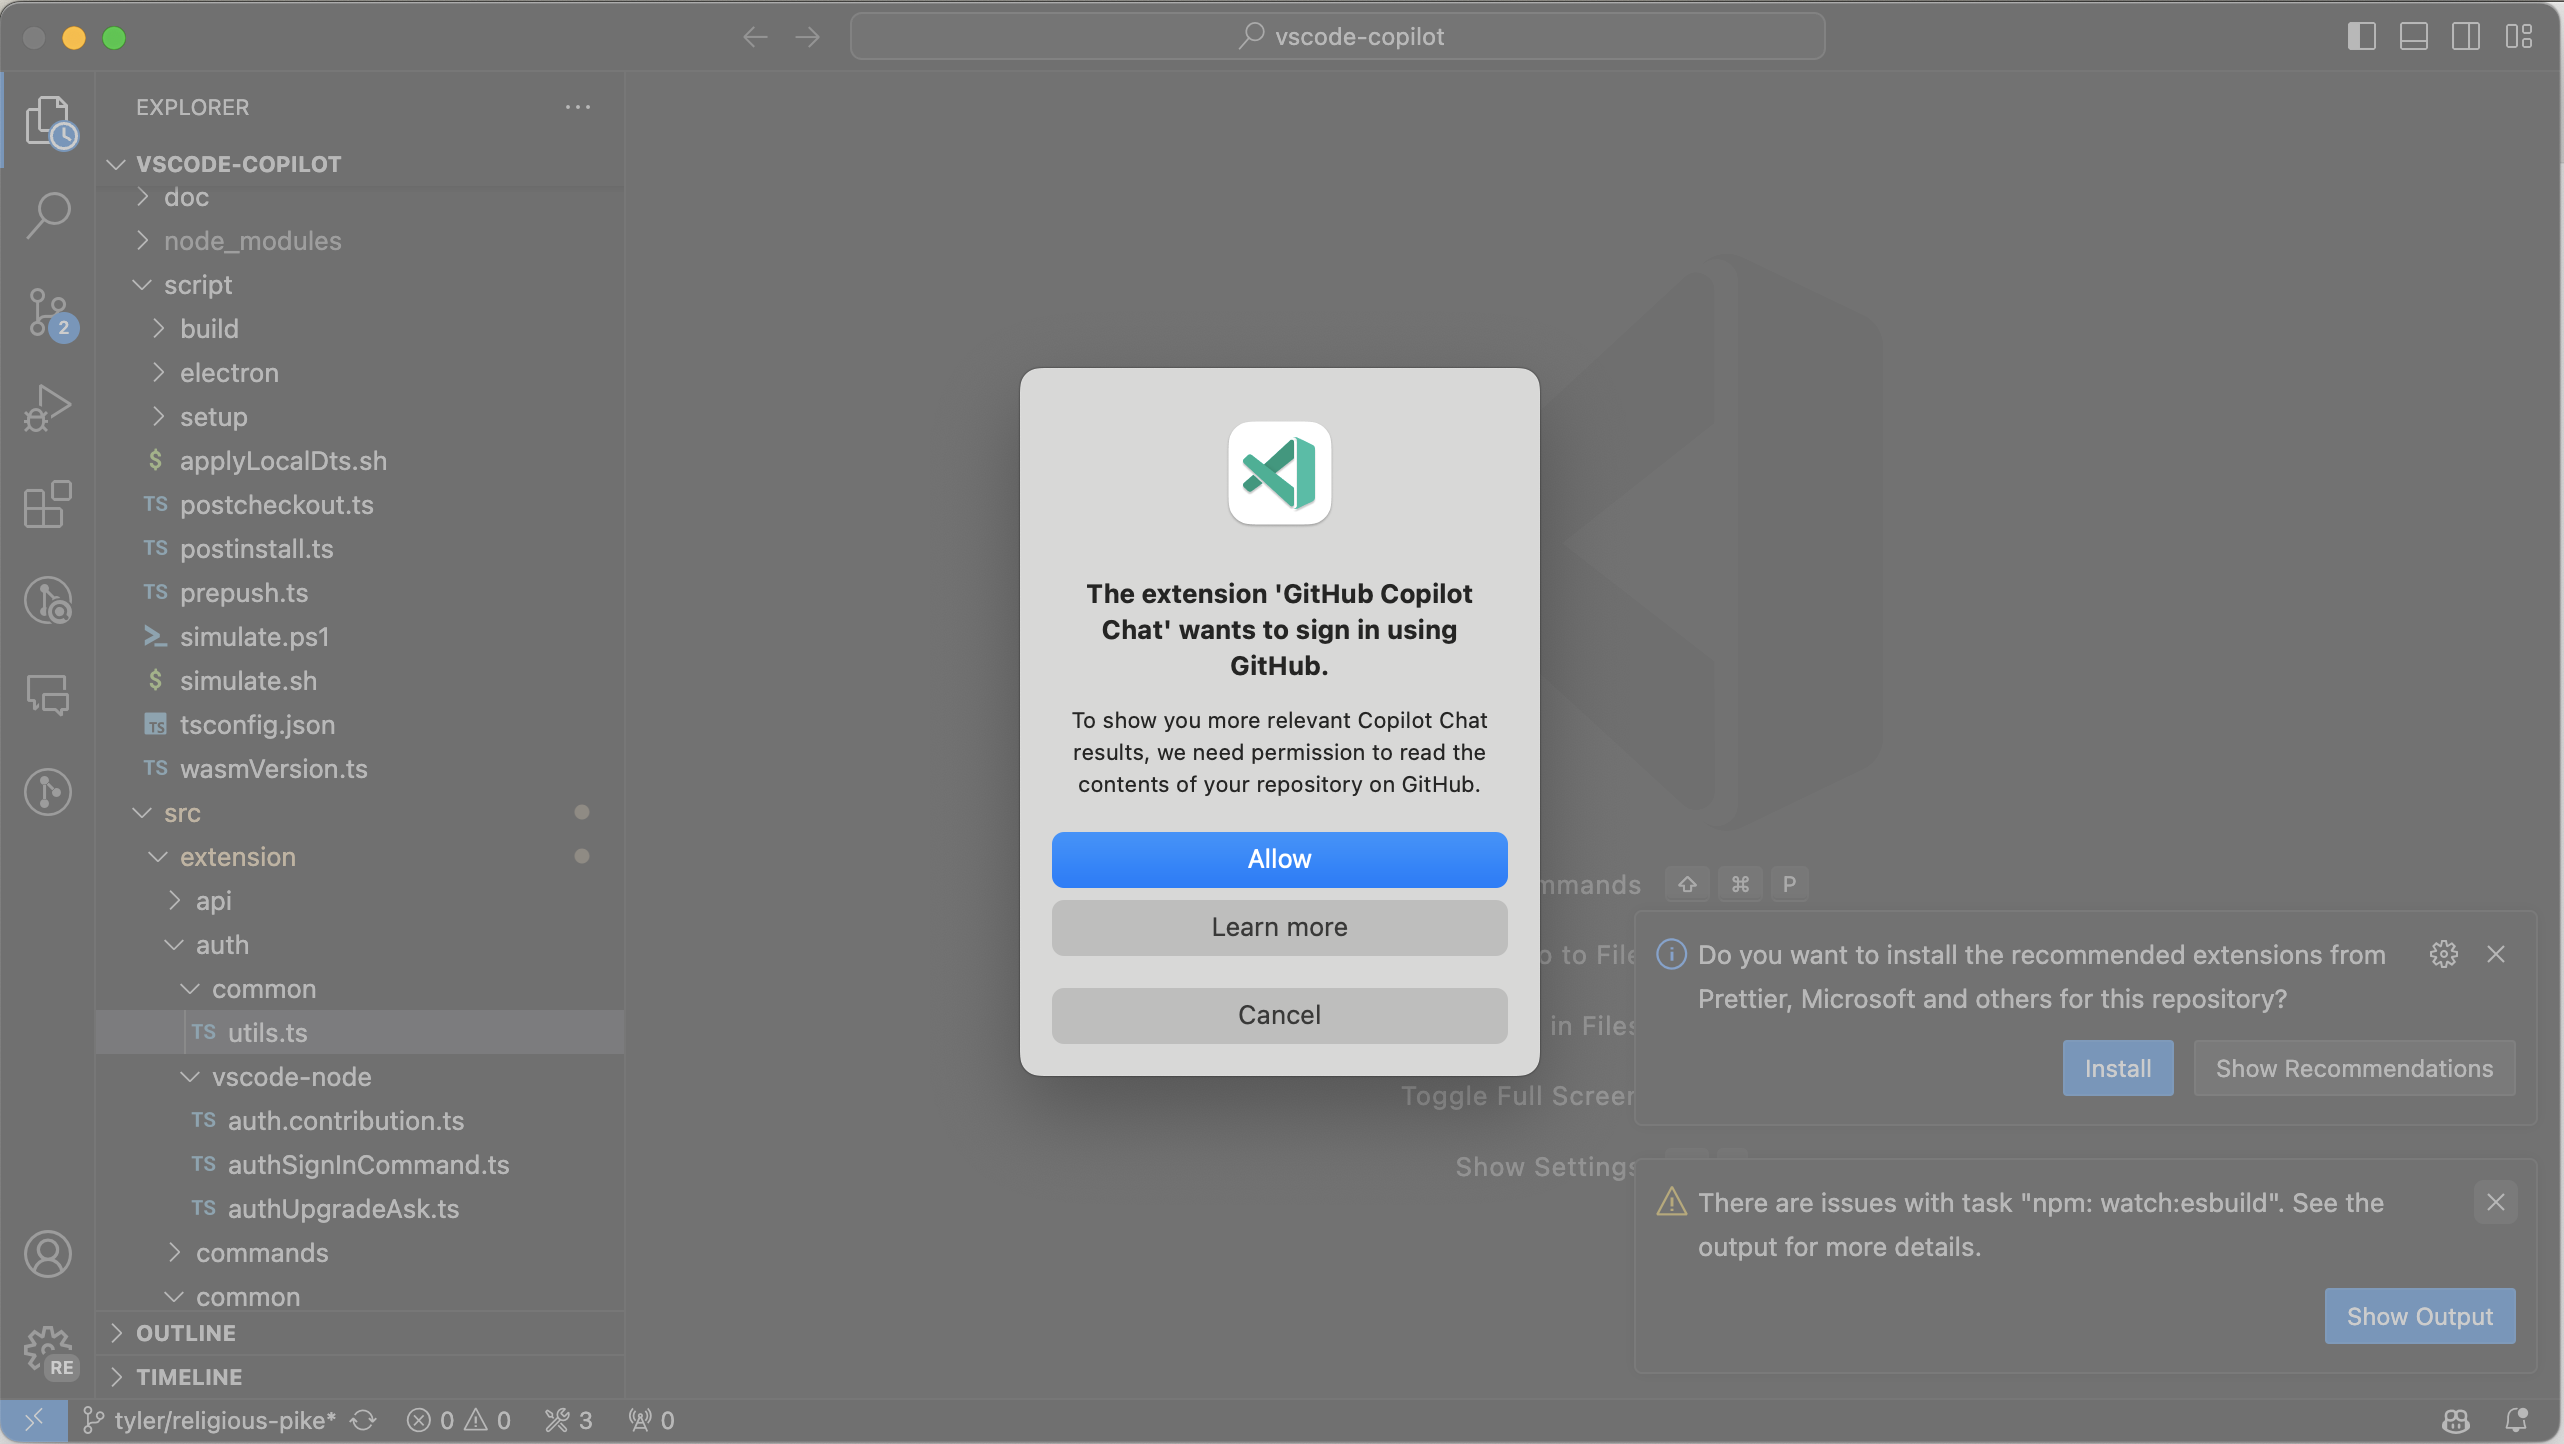
The Learn more button takes you to our documentation on authentication requirements.
Variable references
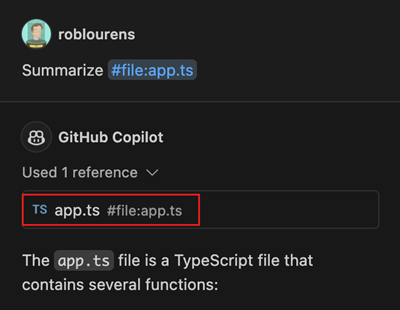
The Used references section in a chat response gives information about the context that is used. Previously, this section only showed context that was pulled in implicitly. Now, it also shows variables that you mentioned explicitly in the chat prompt, such as #file or #editor. If a variable is missing from the Used references, it might indicate that it was ignored because it's too large for the context window of the language model.
Secondary chat submit actions
In the Chat view, the chat submit button now has a dropdown for easy access to more actions.
- Send to @workspace submits your query to the
@workspacechat participant, which is useful for questions about the contents of your workspace - Send to New Chat starts a new empty chat, and then submits the query

Scope selection when using Copilot: Explain This
When you use /explain without a selection in your active editor, and there are multiple scopes of interest, we've added support for prompting to clarify which symbol or block scope to explain.
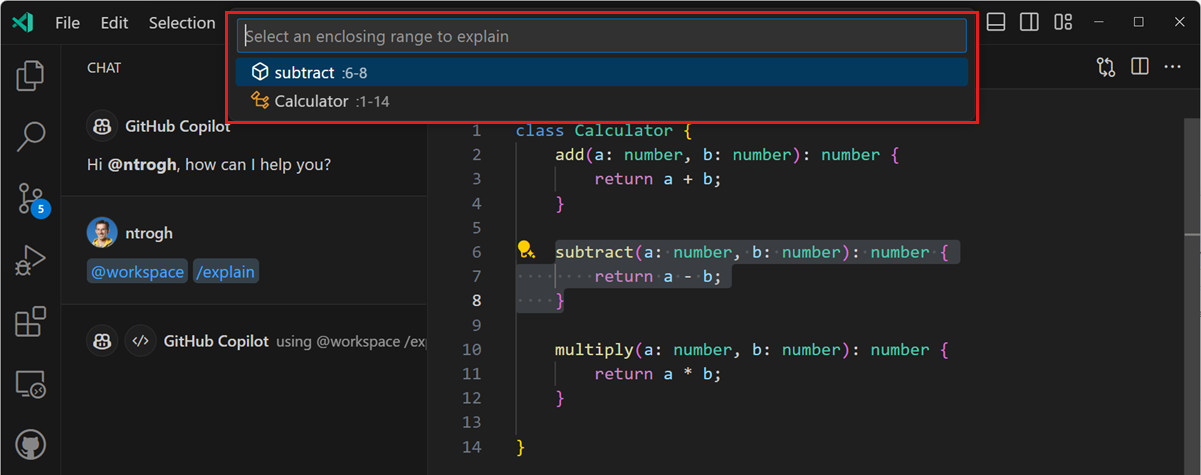
This behavior is currently opt-in, behind the github.copilot.chat.scopeSelection setting.
Python
Improved Debug config selection for Flask and Django
Creating launch configurations for Flask and Django apps just got easier! Improvements have been made to detect possible startup files in your workspace when creating a launch.json for your web app.
For Django, the Python Debugger extension looks for manage.py or app.py files in the root or a subdirectory one level lower in your workspace. For Flask, the extension looks for wsgi.py, app.py, or init.py files that contain the declaration of a Flask application (for example, app = Flask()).
If those files are not found in the project, the dropdown shows a Default option for the corresponding project type, even though that file might not be present.
Hatch environment discovery
Hatch environments are now discovered and activated by default, similar to other common environments, such as Venv, Conda, and Poetry. Furthermore, in the case of Hatch, where an explicit environment identifier is not registered, the extension is able to determine the environment type (Hatch) from the environment locator.
Automatic environment selection for pipenv, pyenv, and Poetry projects
If your workspace contains a pipenv, pyenv, or Poetry environment, the corresponding environment is now automatically selected for your workspace. Previously, the extension correctly discovered these environments, but selected the default global interpreter, which required you to manually select the appropriate environment for your workspace.
Now, the Python extension infers the activated environment based on the presence of the environment and any corresponding configuration files. For example, in the case of pyenv, the extension looks at the .python-version file to automatically select the appropriate interpreter for the workspace.
Report Issue command improvements
The Python and Python Debugger extensions now make it easier for you to report issues to our repos! If you file an issue with the Report Issue command (workbench.action.openIssueReporter), most of the heavy lifting is already done, and you're only prompted for some additional info so our team can efficiently triage the problem you are encountering.
To file an issue using the Help: Report Issue command for @vscode-python or @vscode-python-debugger, choose Python or Python Debugger respectively from the extension dropdown.
GitHub Pull Requests
There has been more progress on the GitHub Pull Requests extension, which enables you to work on, create, and manage pull requests and issues. New features include:
- Outdated comments are displayed differently from current comments in the Comments view.
- The new
autovalue forgithubPullRequests.createDefaultBaseBranchuses the upstream's default branch as the base branch for fork repositories. - Comment threads in the Comments view have inline actions (resolve/unresolve and "Diff Comment with HEAD" for outdated comments) and context menu actions.
Review the changelog for the 0.86.0 release of the extension to learn about the other highlights.
Jupyter
Cell execution analysis improvements
With the latest Pylance prerelease, we have better dependency analysis for Jupyter cells. It now understands module imports, which is especially useful when you have a cell that imports a module that was defined in a previous cell.
To enable this feature, install the latest Pylance prerelease in VS Code Insiders, and enable the jupyter.executionAnalysis.enabled and notebook.consolidatedRunButton settings.
Extension authoring
Use Issue Reporter command for extension bug reporting
Last iteration, we finalized a way for extensions to contribute extra data or templates to fill out when submitting to GitHub via VS Code's Issue Reporter. Extensions can contribute a command, which can be accessed via the Help: Report Issue... command. Selecting their extension runs their contributed command. Please review our issue reporting documentation/release notes for more information on how this can work with your extension!
Additionally, all installed extensions can be quickly reported on via Quick Open. By typing issue in Quick Open (⌘P (Windows, Linux Ctrl+P)), you can quickly select or search for an installed extension to report on.
Certain extensions will start moving over to utilizing this new issue reporting flow and will no longer need custom Report Issue... commands that are contributed directly into the command palette.
Preview Features
Rescaling overlapping glyph in the terminal
A new setting terminal.integrated.rescaleOverlappingGlyphs is available, which rescales glyphs that overlap following cells. This is intended to cover ambiguous width characters, which might have font glyphs that don't match what the backing pty/unicode version thinks it is. For example, in most fonts the roman numeral unicode characters (U+2160+) typically takes up multiple cells, so they are rescaled horizontally when this setting is enabled.
Without rescaling:

With rescaling:

The rules for when rescaling happens are still being tweaked and we are considering enabling this by default in the future when it's solid. If you try this out and see characters that are being rescaled but should not be, please create an issue.
Local workspace extensions
We are excited to introduce this new preview feature that allows you to package an extension directly in your workspace. This feature is designed to cater to your specific workspace needs and provide a more tailored development experience.
To use this feature, you need to package your extension in the .vscode/extensions folder within your workspace. VS Code then shows this extension in the Workspace Recommendations section of the Extensions view from where users can install it. VS Code installs this extension only for that workspace. It also requires the user to trust the workspace before installing and running this extension.
For instance, consider the vscode-selfhost-test-provider extension in the VS Code repository. This extension plugs in test capabilities, enabling contributors to view and run tests directly within the workspace. Following screenshot shows the vscode-selfhost-test-provider extension in the Workspace Recommendations section of the Extensions view and the ability to install it.
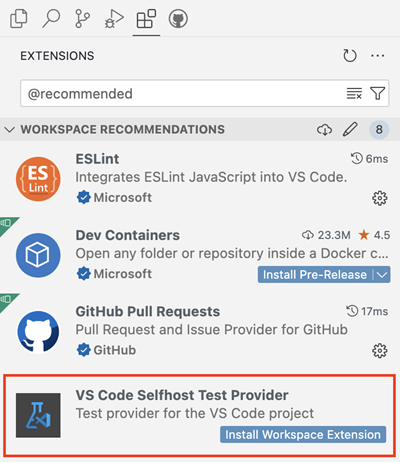
This feature is available for preview in the Insiders release via extensions.experimental.supportWorkspaceExtensions. Try it out and let us know your feedback by creating issues in the VS Code repository.
Proposed APIs
Terminal shell integration API
A new proposed API that enables accessing some of the information provided by shell integration-activated terminals is now available. With this API, it is possible to listen to the incoming data and exit codes of commands being executed in the terminal. It also introduces a more reliable way to execute commands that wait for the prompt to be available, before sending the command which helps fix some conflicts/race conditions that can occur with various shell set ups.
Here's an example of using the Terminal.shellIntegration.executeCommand proposal:
// Execute a command in a terminal immediately after being created
const myTerm = window.createTerminal();
window.onDidActivateTerminalShellIntegration(async ({ terminal, shellIntegration }) => {
  if (terminal === myTerm) {
    const command = shellIntegration.executeCommand('echo "Hello world"');
    const code = await command.exitCode;
    console.log(`Command exited with code ${code}`);
  }
}));

// Fallback to sendText if there is no shell integration within 3 seconds of launching
setTimeout(() => {
  if (!myTerm.shellIntegration) {
    myTerm.sendText('echo "Hello world"');
    // Without shell integration, we can't know when the command has finished or what the
    // exit code was.
  }
}, 3000);
Here's an example of listening to the data stream of a command:
// Create a terminal and log all data via console.log
const myTerm = window.createTerminal();
window.onDidStartTerminalShellExecution(execution => {
  if (execution.terminal === myTerm) {
    const stream = execution.createDataStream();
    for await (const data of stream) {
      console.log(data);
    }
  }
});
You can review the new API here.
Learn More property for authentication API
This iteration, we added a new proposed API that enables you to specify a learnMore property in AuthenticationForceNewSessionOptions. The idea is that if you call getSession with a forceNewSession property in the options, you can include a URI that would be presented to the user to learn more about why you're asking for authentication. Here's an example of what that looks like:

Here's what that looks like in code:
vscode.authentication.getSession('github', ['repo'], {
  forceNewSession: {
    detail: l10n.t('To show you more relevant Copilot Chat results, we need permission to read the contents of your repository on GitHub.'),
    learnMore: Uri.parse('https://aka.ms/copilotRepoScope')
  };
});
You can review the new API here.
Outdated comments
The new comment thread applicability property lets comment threads be marked as outdated in the Comments view:

You can see the API proposal here.
Comment view menus
The commentsView/commentThread/context proposed menu enables actions to be added to the right-click context menu of a comment thread in the Comments view. The usual inline group is also respected, so that actions are shown in the Comments view inline.

Engineering
Electron 28 update
In this iteration, we are promoting the Electron 28 update to users on our stable release. This update comes with Chromium 120.0.6099.291 and Node.js 18.18.2. We want to thank everyone who self-hosted on Insiders builds and provided early feedback.
Notable fixes
- 204886 Opening a file on a different path but with the same name in the simple file picker fails
Thank you
Last but certainly not least, a big Thank You to the contributors of VS Code.
Issue tracking
Contributions to our issue tracking:
- @gjsjohnmurray (John Murray)
- @IllusionMH (Andrii Dieiev)
- @RedCMD (RedCMD)
- @starball5 (starball)
- @the-coder-o (Abdul basit)
- @ArturoDent (ArturoDent)
Pull requests
Contributions to vscode:
- @333fred (Fred Silberberg): Do not trim whitespace when part of strings or regexes PR #198164
- @89netraM (Mårten Åsberg): Render final line number for interval setting PR #207227
- @a-stewart (Anthony Stewart)
- Stop the cursor from jumping when changing prefix in QuickAccess - v2 PR #204702
- Export ILocalizedString in nls.mock.ts PR #206449
- @akbyrd (Adam Byrd)
- Implement separate colors for primary and secondary cursors when multiple cursors are present PR #181991
- Change editor.action.focusNextCursor to reveal the primary cursor instead of all cursors PR #182148
- @AndreasBackx (Andreas Backx): Fix smooth scrolling Linux Wayland. PR #205122
- @andrewbranch (Andrew Branch): [typescript-language-features] Fix autoImportFileExcludePatterns format to work on Windows PR #202762
- @andyscho (Andy Schoenberger): Only one subscriber for kernels for onDidChangeSelectedNotebooks PR #204417
- @BABA983 (BABA): Better testing side bar retried color PR #207949
- @BrandonXLF (Brandon Fowler): Override CSS content for terminal tab image icons PR #207220
- @BrookMaoDev (Brook Mao): Improved description for editor.useTabStops setting PR #206552
- @btwiuse: cli: add --server-base-path flag to
code serve-webcommand PR #207932 - @BusinessDuck (Dmitriy Yurov): Fix 'e.getModifierState is not a function' error for browser auto filled form events PR #206883
- @cchanche (Clément Chanchevrier): Resize terminal direction PR #205015
- @CGNonofr (Loïc Mangeonjean)
- Fix keyboard layout detection PR #205193
- Fix fullscreen container dimension detection when not directly on body PR #205884
- @cpendery (Chapman Pendery)
- fix: terminal suggestions to sort by fuzzy score PR #208486
- fix: don't show terminal suggestions when keybindings are sent through to shell PR #208523
- fix: suggest widget persisting on completion acceptance PR #208524
- @deyihu (hu de yi): editor paste event result return ClipboardEvent PR #192732
- @dgileadi (David Gileadi): Introduce minimap section headers, a la Xcode PR #190759
- @futurist (James Yang): feat: add ipcLogger and timeoutDelay for IPCServer PR #193896
- @gjsjohnmurray (John Murray): Make channel log level settable from output view PR #205159
- @harbin1053020115 (ermin.zem): fix: Select first extension walkthrough for first launch if no built-in walkthroughs present. PR #207303
- @hickford (M Hickford): Sort lines: sort all lines if nothing selected. PR #200325
- @hsfzxjy (Xie Jingyi)
- Fix setting editor list item overflow PR #206681
- Add log point on middle clicking gutter PR #206684
- @IncognitaDev (Luis Sousa): Feat: Add PascalCase to CaseActions PR #206259
- @its-miroma (Miroma): Change default YAML extension PR #206447
- @jeanp413 (Jean Pierre): Fixes breadcrumbs widget does not get resized properly PR #200591
- @jeremy-rifkin (Jeremy Rifkin): Expand monarch functionality to allow state access within rules PR #183463
- @jhasse (Jan Niklas Hasse): Use indentSize instead of tabSize for LineCommentCommand PR #193811
- @Krzysztof-Cieslak (Krzysztof Cieślak)
- Fix off-by-one error in rendering removals in inline edits PR #205890
- Inline edit - make sure we cancel in-progress request on blur PR #206430
- Inline Edit - make sure we finalize accepting before requesting new edit PR #206525
- @lusingander (Kyosuke Fujimoto): Fix broken description of
editor.cursorSurroundingLinesStylesetting PR #201482 - @mahmoudsalah1993 (Mahmoud Salah): for diff editors, resolve the modified editor to allow run tests in c… PR #206026
- @marrej (Marcus Revaj): # Add partial accept kind to inline completion handle PR #202668
- @mkasenberg: searchEditor: Add option to peek with a single click PR #204413
- @mroch (Marshall Roch): fix "Extension [object Object] is not known" PR #207764
- @NriotHrreion (NoahHrreion): Fix the unexpected position of hover widgets PR #205502
- @orgads (Orgad Shaneh)
- Tunnel: Extend port mapping lookup also for querystring (take 2) PR #204807
- Tunnel: Re-add unit tests for port mapping PR #207249
- @PmcFizz (Fizz): Update IActionDescriptor.precondition desc PR #176124
- @raphaelgpalma (Raphael Palma): Fix grammatical error: 'But allow them if the are made from inside an…' PR #207584
- @rehmsen (Ole): Log
resourcetelemetry also for side-by-side views on browsers. PR #208196 - @russelldavis (Russell Davis): Fix decreaseIndentPattern for javascript and typescript PR #201425
- @samdenty (Sam Denty): feat(web/lifecycleService): correct startupKind PR #206563
- @Sidebail (VLADIMIR VATSURIN): Fix file relative path link PR #181475
- @SimonSiefke (Simon Siefke): fix: memory leak in notebook baseCellViewModel PR #205499
- @solimant: Honor GitHub brand name casing PR #208503
- @thegecko (Rob Moran): Update extensionPaths when web extension host started PR #193849
- @vinistock (Vinicius Stock): Fix accidental dedent for
inandwhendedent in Ruby comments PR #206132 - @yamachu (Yusuke Yamada): Fixed to show files in deepest directory in search results PR #206609
- @Yesterday17 (Yesterday17): Dispatch GestureEvent in node depth order PR #200612
- @yiliang114 (易良): Fix Copy/Cut command not working in webview PR #206529
- @yutotnh (yutotnh): Add support for recognizing word locales in word operations (#_50045) PR #203605
Contributions to vscode-css-languageservice:
- @balaji-sivasakthi (Balaji Sivasakthi): feat: support hover tooltip for scss PR #367
Contributions to vscode-eslint:
- @JoshuaKGoldberg (Josh Goldberg ✨): feat: support json, json5, jsonc in eslint.probe setting PR #1787
- @remcohaszing (Remco Haszing)
Contributions to vscode-extension-samples:
- @juliankasimir (Julian Kasimir): feat(lang): replace German with English in showQuickPick function PR #983
Contributions to vscode-hexeditor:
Contributions to vscode-js-debug:
- @Beanyy: Fix formatting of number 0 in remote object when description is not set PR #1968
- @mdh1418 (Mitchell Hwang): [CDP] Send telemetry for DotnetDebugger error event PR #1961
- @relief-melone (Relief.Melone): added proxy support for build PR #1965
Contributions to vscode-json-languageservice:
- @denisw (Denis Washington): Fix sorting error in case of nested trailing comma PR #223
Contributions to vscode-pull-request-github:
- @ipcjs (ipcjs): fix: make
review.openLocalFilesupport triggering from the keyboard. PR #5840 - @mohamedamara1 (Mohamed Amara): fixed ID of IssueOverviewPanel PR #5822
Contributions to vscode-pylint:
- @MGasiewski: Add logic to replace tilde with home environment PR #524
Contributions to vscode-python-debugger:
- @bersbersbers: Update
launch.jsonschema PR #243 - @StephanTLavavej (Stephan T. Lavavej): Fix typos PR #217
Contributions to debug-adapter-protocol:
- @andyw8 (Andy Waite): Update adapters list for Ruby LSP PR #471
- @svaante (Daniel Pettersson): Add Emacs dape package to Implementations tools section PR #469
Contributions to inno-updater:
- @ChayimFriedman2 (Chayim Refael Friedman): Remove unneeded
unsafe impl SendPR #25
Contributions to language-server-protocol:
- @asukaminato0721 (Asuka Minato)
- @iliaamiri (Ilia Abedianamiri): A small typo in the summary paragraph PR #1903
- @lukaskesch (Lukas Kesch): Updating copyright year to 2024 in footer.html PR #1909
- @MariaSolOs (Maria José Solano): Specification for MarkupContent support in diagnostic messages PR #1905
- @oliviacrain (Olivia Crain): Remove server entry for rnix-lsp PR #1902
Contributions to monaco-editor:
- @jeremy-rifkin (Jeremy Rifkin): Fix bug with highlighting of C++ raw string literals PR #4436
Contributions to node-pty: