April 2021 (version 1.56)
Update 1.56.1: The update addresses these security issues.
Update 1.56.2: The update addresses these issues.
Downloads: Windows: x64 Arm64 | Mac: Universal Intel silicon | Linux: deb rpm tarball Arm snap
Welcome to the April 2021 release of Visual Studio Code. The VS Code team has been busy this month working on several longer lead time updates so check out the Preview features section to learn what's upcoming. Here are some of the highlights included in this release:
- Improved hover feedback - Helps you quickly find clickable editor actions.
- Terminal profile improvements - Create a custom default terminal profile.
- Debugger inline values - Display variable values inline during debugging sessions.
- Notebook KaTeX support - Math support in notebook Markdown cells.
- Dev Containers volumes view - Manage mounted volumes within Docker containers.
- winget installation - VS Code is available via the Windows Package Manager.
- New introductory videos - Videos for getting started with VS Code as well as working with C++.
- Terminal tabs preview - Get a first look at managing open terminals with the new tabs view.
If you'd like to read these release notes online, go to Updates on code.visualstudio.com.
Join us live at the VS Code team's livestream on Tuesday, May 11 at 8am Pacific (4pm London) to see a demo of what's new in this release, and ask us questions live.
Insiders: Want to try new features as soon as possible? You can download the nightly Insiders build and try the latest updates as soon as they are available.
Workbench
Improved action hover feedback
We have changed the mouse hover feedback for actions all around the workbench, to provide a better UX around clickable actions.
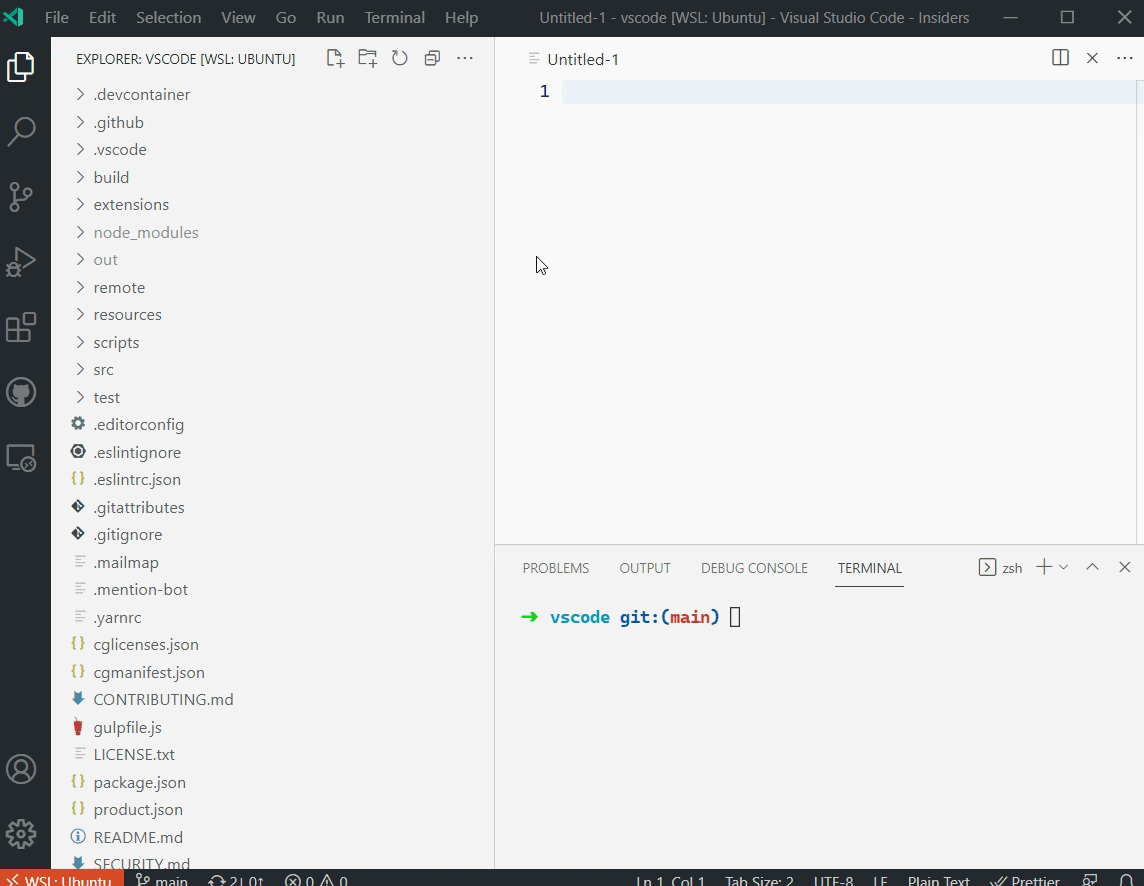
Untitled editors hint
We have noticed that many new users are not aware that a language has to be set in order to get full VS Code language support. To help with this problem, we have introduced a hint for untitled editors to help users set the correct language mode. The untitled hint might not be helpful to advanced users, so it goes away immediately as you start typing or you can select don't show to never display the hint again.
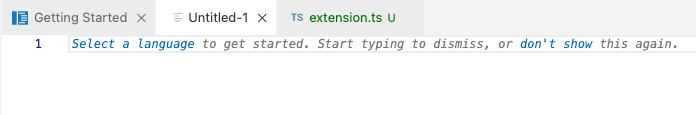
Default custom editor and notebook resolution
If you have two editors that both state they should be your default editor for a resource (for example, an image viewer and an image editor), you will receive a prompt to resolve the conflict.
In the short video below, the user opens a PNG file, which is associated with two editors. The notification lets the user keep using the Luna Paint Image Editor or configure a new default, which they do and start using the binary Hex Editor.
Updated custom dialogs
We have updated our custom dialog styles, which you can enable via "window.dialogStyle": "custom". VS Code now dims the background so there is better focus on the dialog and also uses the secondary button style when there is more than one action.
Product Icon Theme: Fluent Icons
You can theme the secondary button style by using the following color tokens:
button.secondaryBackgroundbutton.secondaryForegroundbutton.secondaryHoverBackground
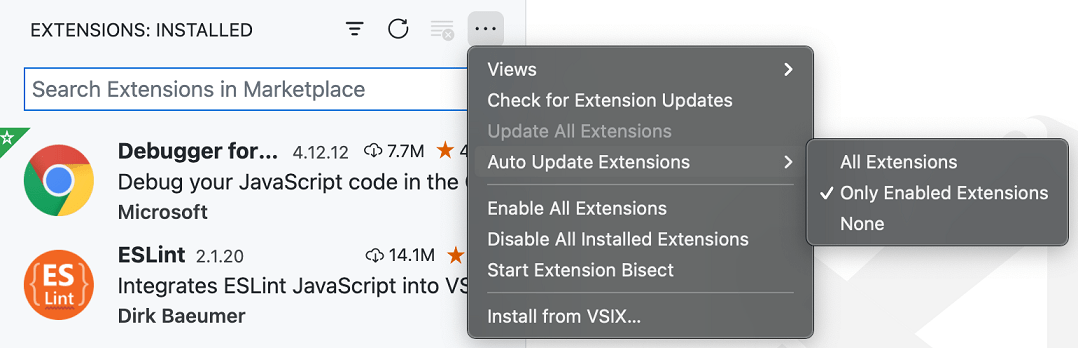
Auto update only enabled extensions
You can now configure VS Code to auto update only your extensions that are currently enabled.
Theme: GitHub Light Theme
Terminal
Profile improvements
Last iteration, we introduced terminal profiles. The terminal now supports setting a default profile with the terminal.integrated.defaultProfile.<platform> settings.
Environment and icon support was also added to the profiles system:
"terminal.integrated.profiles.windows": {
  "PowerShell": {
    "source": "PowerShell",
    "overrideName": true,
    "icon": "terminal-powershell",
    "env": {
      "TEST_VAR": "value"
    }
  }
},
"terminal.integrated.defaultProfile.windows": "PowerShell",
Going forward, these settings are the recommended way to switch out the default terminal configuration and the terminal.integrated.shell and terminal.integrated.shellArgs settings have been deprecated.
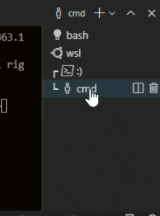
New terminal picker
Profiles and setting shortcuts have moved out of the dropdown and into a new + button with a dropdown.
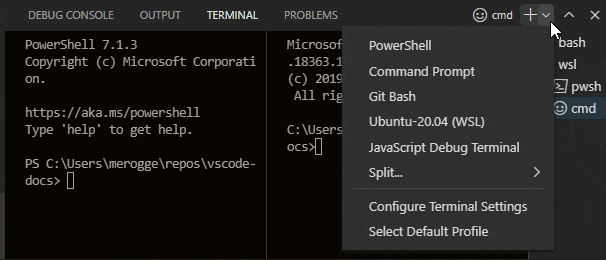
This also supports creating a new split terminal based on a non-default profile.
New keybindings
The terminal has several new default keybindings this release:
- Move to previous terminal -
Ctrl+PageUp(macOSCmd+Shift+]) - Move to next terminal -
Ctrl+PageDown(macOSCmd+shift+[) - Focus terminal tabs view -
Ctrl+Shift+\(macOSCmd+Shift+\) - Terminal tabs preview
As always, these default keybindings can be removed or custom keybindings can be added via the keybindings system.
Linux selection paste command
The new command workbench.action.terminal.pasteSelection is available on Linux to paste into the terminal from the selection clipboard.
Terminal workspace shell permissions changed
In order to support incoming changes related to profiles, the prompt that would show if terminal settings were present in .vscode/settings.json was removed in favor of a setting to opt into workspace settings use. Note that this can be dangerous in untrusted workspaces.
"terminal.integrated.allowWorkspaceConfiguration": true
When Workspace Trust is enabled by default, we will remove this and use that system.
Tasks
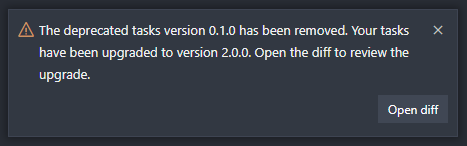
Removal of Tasks 0.1.0 with upgrade
Tasks 2.0.0 has been available and working well for over three years, and tasks 0.1.0 has been deprecated throughout that time. In light of our Node.js-free renderer goal, tasks 0.1.0 has been deleted rather than brought into the Node.js-free world. When you open a folder that contains 0.1.0 tasks, they will be automatically upgraded to version 2.0.0 for you.
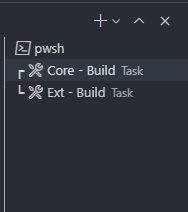
No "Task" prefix in terminal tabs
When using the new Terminal tabs feature, the "Task" prefix will no longer be added to the terminal name. Instead, tasks are indicated by the "tools" icon to make better use of the available space.
Better matching with eslint-stylish
The $eslint-stylish problem matcher matches multiline problems more accurately.
Debugging
Breakpoints view improvements
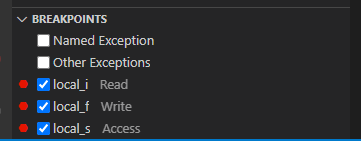
Access type is shown for data breakpoints
For data breakpoints, VS Code now shows the access type ("Read", "Write", or "Access") next to its name in the Breakpoints view.
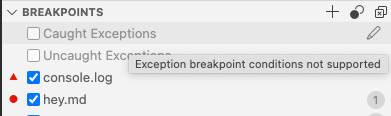
Better status/error reporting for exception breakpoints
For exception breakpoints, VS Code now shows their individual verification status and detailed reason in the Breakpoints view. If an exception breakpoint cannot be verified (for example because its condition contains a syntax error), it will be grayed out and, on hover, the corresponding error message is shown.
Other UI improvements
Alternative behavior for Stop and Disconnect commands
A debug session is typically stopped via the Debug: Stop and Debug: Disconnect commands. If the debug session is of type launch, the Stop command does not only stop the session but it also terminates the debuggee. For attach type debug sessions, there is a Disconnect command, which stops debugging and resumes execution of the debuggee.
With this release, it is now possible to flip this behavior by pressing the Alt modifier while triggering the command from the Debug toolbar. Altering the behavior makes it possible to leave the debuggee running for launch type debug sessions, and to terminate the debuggee for attach type debug sessions. Apart from using Alt with the default commands, it is also possible to access both the Debug: Stop and Debug: Disconnect commands from the Command Palette for both launch and attach debug sessions.
The alternative behavior is only available for debug extensions that have opted in to this feature.
Improved flow for installing missing debug extensions
We have improved the flow if a user wants to start debugging but hasn't installed the necessary language extension that provides debugging support (like Python or Java). When this happens, VS Code now prompts the user to install the appropriate extension.
Call stack column stopped indicator
VS Code now renders the Call Stack column indicator every time a debuggee is stopped on a line. This should help identify where on a line the program is currently stopped.
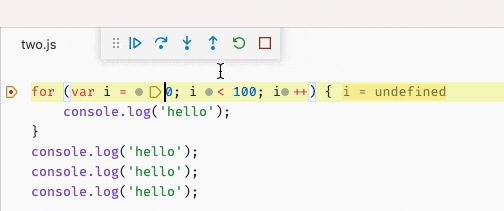
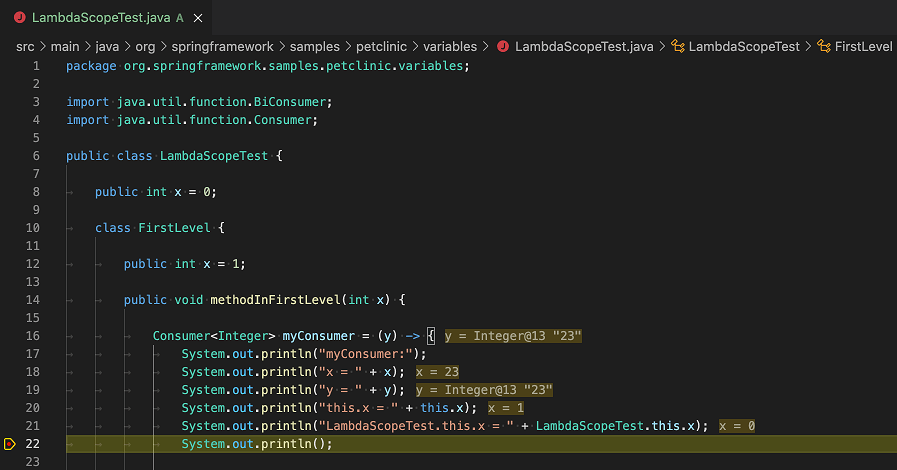
Inline values by default for some languages
VS Code's debugger UI supports Inline values that show variable values inline in the editor when stepping through source code. This feature is based on a generic implementation in VS Code core and so may not be a perfect fit for all languages, even sometimes showing incorrect values because the generic approach doesn't understand the underlying source language. For these reasons, the feature was not enabled by default.
With a new debugger extension API, it is now possible for language extensions to provide correct inline value support and we are enabling the Improved inline values feature by default.
To enable this feature, the debug.inlineValues setting has a new (default) value auto. When set to auto, inline values are automatically enabled for those languages that have "improved inline value" support.
The Debugger for Java extension is one of the first debugger extensions to adopt the API. In the screenshot below, the accurate values of the Java variables are displayed right next to their usage.
You can get inline values while debugging PowerShell scripts using the Inline Values support for PowerShell extension.
Debug view displayed on break
The default value of the debug.openDebug setting is now openOnDebugBreak so that on every breakpoint hit, VS Code will open the Debug view. The Debug view is also displayed on first session start.
JavaScript debugging
As usual, the complete list of changes can be found in the vscode-js-debug changelog.
Improved breakpoint diagnostic tool discoverability
Based on heuristics, VS Code will show a notification that suggests opening the breakpoint diagnostic tool if it detects the user may be having trouble getting breakpoints to bind.
This prompt will initially be visible only to a subset of users as we experiment with its efficacy and assertiveness.
Private Class Field Support
Private class fields are now visible and can be inspected in the debugger.
Notebooks
Toggle line numbers
You can now temporarily toggle the line numbers of a cell in the current session from the cell toolbar, or change the visibility of line numbers for all notebooks through the notebook.lineNumbers setting.
Cell toolbar position per file type
The cell toolbar position can be now customized per file type through the notebook.cellToolbarLocation setting. For example, you can have the cell toolbar on the right side for GitHub Issue notebooks but have it on the left for Jupyter notebooks.
Math support in Markdown cells
You can now use math equations inside of notebook Markdown cells:
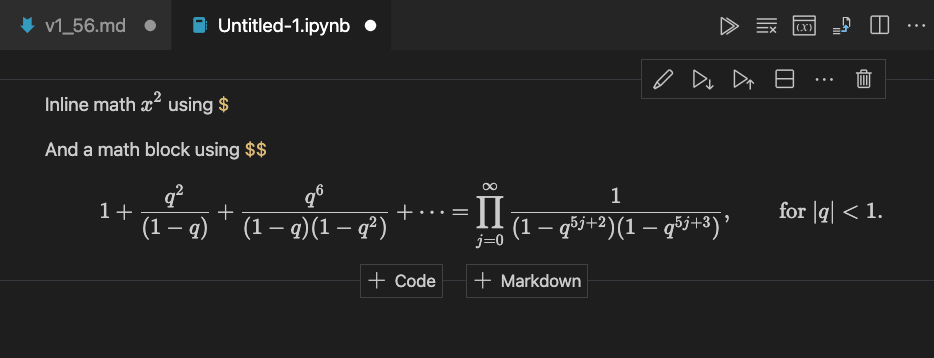
VS Code uses KaTeX for rendering the equations. There are two ways to embed a math equation into a Markdown cell:
- Using single dollar signs:
$...$. This creates an inline math equation. - Using double dollar signs:
$$...$$. This creates a centered, block math equation.
We implemented math support using an experimental notebook markup renders API, which is still in development. Our eventual goal with this API is to also allow extensions to extend the rendering of Markdown in notebooks.
Languages
Markdown preview typographer support
The new markdown.preview.typographer setting lets you enabled smart quotes and simple typographic replacements in the built-in Markdown preview.
In the example below, Markdown text such as (c) gets automatically replaced by copyright symbol © in the preview:
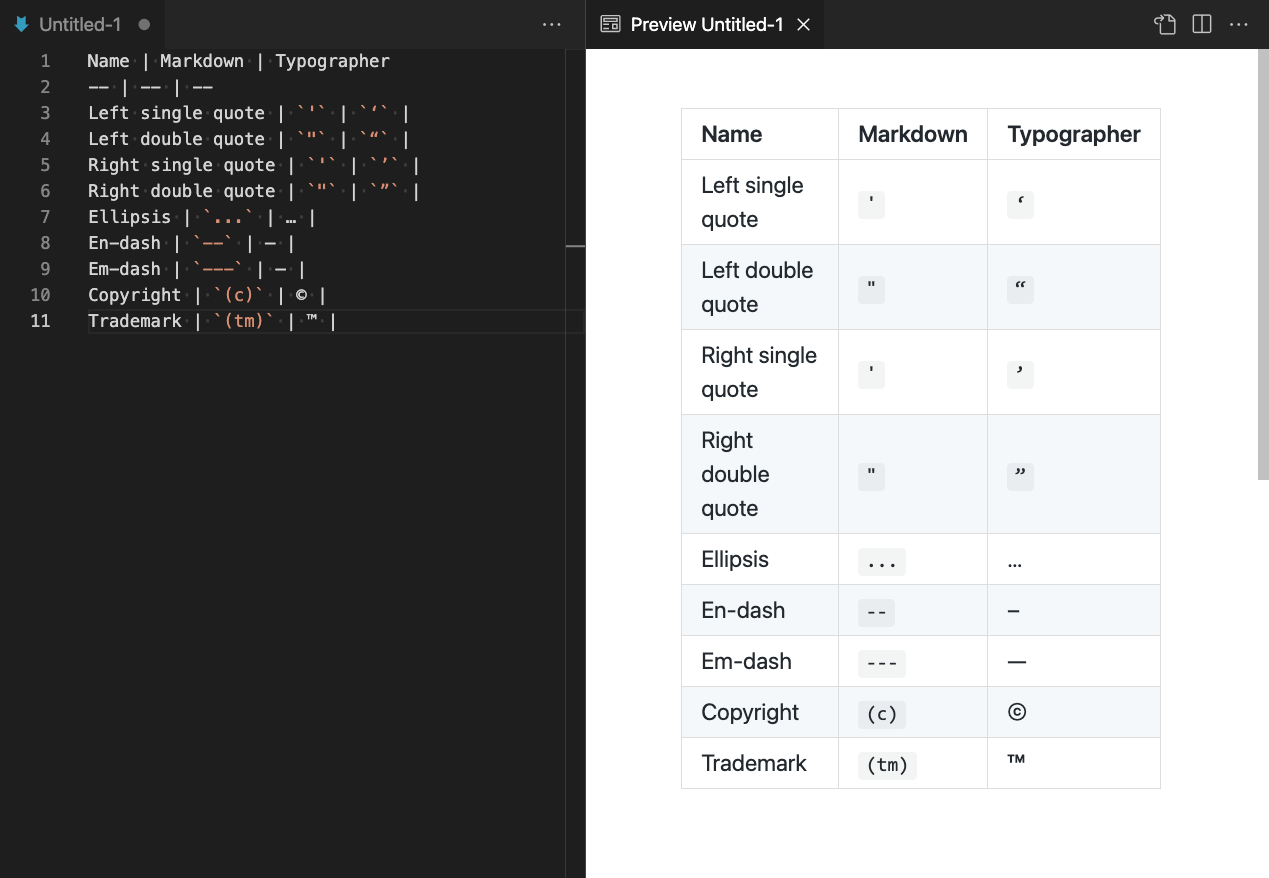
The markdown.preview.typographer setting is disabled by default.
More files recognized as shellscript
Files with the .xsession and .xprofile filename extensions will be automatically recognized as shellscript.
Preview features
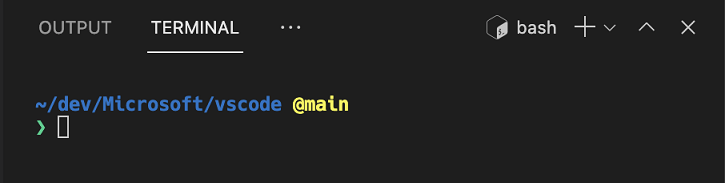
Terminal tabs
Tabs in the terminal are available as a preview feature and can be enabled with the following setting:
"terminal.integrated.tabs.enabled": true
When enabled, the new tabs view will only show by default when there are at least two terminals. For single terminals, the tab is "inlined" into the panel title like so:
Each tab supports several actions via the context menu.
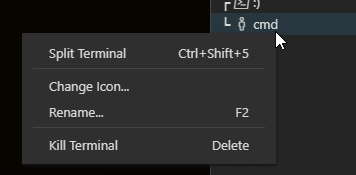
Split and kill terminal are available on hover.
We've tried to align how the new tabs behave with how the Explorer works. Here are some of the other behaviors:
- Double-clicking the empty space will create a new terminal.
- Double-clicking the sash will toggle the tabs view width between the "ideal" size that displays all the titles without truncating and a narrow view that shows only the icons.
- The tabs can be moved to the left side using the
terminal.integrated.tabs.locationsetting. - Various other configuration settings are available under
terminal.integrated.tabs.
Terminal statuses
Along with tabs, we have introduced the concept of statuses to the terminal. A terminal can have many statuses, each of which represents a state the terminal can be in temporarily, with the highest severity one being displayed next to the tab. Status icons appear to the right of the terminal title in the tabs view. On hover, details of the status and any associated actions are presented.
![]()
For now, these states are supported:
- Relaunch needed: A warning icon status is used if an extension wants to change a terminal's environment.
- Disconnected: A plug icon status is used when the terminal loses its connection with its process.
- Bell: A bell icon appears when the bell is enabled via the
terminal.integrated.enableBellsetting and the terminal bell triggers.
We plan to support task states soon so that task run status is available at a glance even without activating the tab.
Welcome Page walkthroughs
We have expanded the walkthroughs contribution for placing content on the Getting Started page to allow for Markdown in both step descriptions and step main content. Extension contributions to the Getting Started page are an experimental feature, and can be enabled with "workbench.welcomePage.experimental.extensionContributions": true,.
The short video belows show an example walkthrough to teach users about the Luna Paint extension.
Custom hover support in Activity bar and Panel
In this milestone, we added experimental support for custom hovers in the Activity bar and Panel. You can enable custom hovers using the setting workbench.experimental.useCustomHover.
Theme: GitHub Light Theme Product Icon Theme: Fluent Icons
Remote Repositories (RemoteHub)
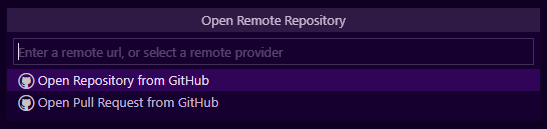
As part of this release, we are previewing a new built-in extension, Remote Repositories (RemoteHub), which allows you to instantly browse, search, edit, and commit to any GitHub repository directly from within VS Code without having to clone or have the repository locally. It is currently only available in the Insiders edition of VS Code.
Getting started
To get started, run the Open Remote Repository... command from the Command Palette. From there, you can paste in any GitHub URL, or choose to search for a specific repository or pull request.
Theme: Amethyst Dark Theme
Once you enter a URL or choose a repository or pull request, VS Code will open a new workspace for that repository. The remote status indicator, on the left side of the Status bar, shows the connected remote provider name, for example GitHub, for the remote repository.
Theme: Amethyst Dark Theme
Features
- Instantly open any GitHub repository without cloning or having the repository locally.
- Easily edit and contribute to any GitHub repository - directly commit your changes to GitHub, or open a pull request.
- Continue in another environment - via the Continue on... command (accessible from the Command Palette or the remote indicator quick pick menu).
- Clone the repository locally
- Clone the repository into a container - requires the Dev Containers extension
- Provides a familiar user interface similar to working on a local repository (*see "Limitations" below).
- Explorer - Open, copy, move, rename, and delete files and folders
- Search - Fast full-text search*
- Source Control - Stage and commit your changes, as well as many other source control actions
- Timeline view - See file history with diff support
- Quick Open - Quickly find files to open
- Remote Indicator - Shows the provider that the remote repository is connected to (for example, GitHub)
- Work on different branches simultaneously - each remote branch is treated like a separate worktree (in Git parlance), meaning that any changes you make are isolated to that branch. You don't need to stash your changes just to switch to a new branch in order to checkout a PR or start on a new work item. And when you go back to the previous branch, your changes will still be there.
- Install the GitHub Pull Requests and Issues extension, and quickly view, explore, and checkout pull requests, view and start working on issues.
Limitations
- Limited language intelligence - Many language servers don't yet understand this virtualized environment. TypeScript supports single file intelligence for remote repositories.
- Limited extension support - As with language servers, many extensions don't work with remote repositories. Extensions can opt-out and will not be activated for virtual workspaces. See the Extension authoring section below for more details.
- Search - Full-text search requires a pre-built index for exact text matching, otherwise it will fallback to GitHub's fuzzy default-branch only native search.
- Terminals - Not supported. Any terminals open will be on your local file system.
- Debugging - Not supported.
- Tasks - Not supported.
Tell us what you think
We are very excited for you to play with Remote Repositories (RemoteHub) and can't wait for your thoughts and feedback. We are just getting started on this journey, so expect the feature set to grow and the limitations to shrink as we continue development. We will also be expanding the set of supported providers. GitHub is just the first provider we are supporting, with Azure Repos coming soon.
TypeScript 4.3
This release continues to improve our support for the upcoming TypeScript 4.3 release. You can read more about the new language features and improvements in TypeScript 4.3 on the TypeScript blog. Here are some of the editor improvements it enables:
- Support for
override. There are also Quick Fixes for adding theoverridekeyword. - Import statement completions. This is like auto import, except you are typing in the import statement itself.
- JSDoc
@linktag support.
To start using the TypeScript 4.3 nightly builds, just install the TypeScript Nightly extension. Please share your feedback and let us know if you run into any bugs with TypeScript 4.3.
Workspace Trust
In last milestone's release notes, we shared our work on Workspace Trust specifically for extension authors. We made great progress this milestone for both the extension API and user experiences. That being said, Workspace Trust will remain disabled for this release, but we would love for you to try it out and provide feedback.
You can enable the feature with the following setting security.workspace.trust.enabled. Once enabled, you will see the following dialog when opening folders in VS Code.
This dialog is important for allowing the user to make a decision early and understand the impact of their decision. Once you understand the feature, you may want to customize when to display the dialog using the security.workspace.trust.startupPrompt setting.
You can follow the development of Workspace Trust and provide feedback in issue #106488.
Contributions to extensions
Remote Development
Work continues on the Remote Development extensions, which allow you to use a container, remote machine, or the Windows Subsystem for Linux (WSL) as a full-featured development environment.
Feature highlights in 1.56 include:
- New volume view when you Clone Repository in Container Volume.
- Local terminal warning when connected to a remote.
- Prompt to install Docker Desktop when starting with the Dev Containers extension.
You can learn about new extension features and bug fixes in the Remote Development release notes.
GitHub Pull Requests and Issues
Work continues on the GitHub Pull Requests and Issues extension, which allows you to work on, create, and manage pull requests and issues.
To learn about all the new features and updates, you can see the full changelog for the 0.26.0 release of the extension.
Extension authoring
Define whether your extension supports a virtual workspace
The new Remote Repositories extension lets you open a folder with content directly from GitHub. It does so by providing a virtual file system and opening a workspace on it. Other extensions do the same. They serve content from ftp-servers, from cloud storage, or from databases and seamlessly provide these as files to the user in VS Code.
The virtual file system feature has existed for some time, however we have observed that not all extensions can support running in a virtual workspace, where the workspace files do not exist physically on disk. For this reason, we have added support for an extension to signal whether it supports running in a virtual workspaces or not. When an extension has opted-out, it will not be activated by VS Code for a virtual workspace and the user will not see errors from this extension.
An extension opts out of a virtual workspace setup in the package.json as shown below:
{
  "capabilities": {
    "virtualWorkspaces": false
  }
}
The goal is that as many extensions as possible support running in a virtual workspace. However, this is not always possible, particularly when an extension is using components that assume that files are physically present. The Virtual Workspaces guide documents how an extension can support a virtual workspace.
Call to Action: Please check whether your extension can handle virtual workspaces, and set the virtualWorkspaces capability accordingly in your package.json.
There will be a transition period until extensions have adopted the new virtualWorkspaces property. Until then, we maintain an internal list for extensions that we think should have the virtualWorkspaces capability set to false. This was done based on an analysis whether the extensions is using the Node.js fs module and is therefore accessing the file system directly. However, the extension author is in a much better position to assess whether an extension supports the virtualWorkspaces capability. To track the adoption, we have created the following tracking issue #122836. If your extension is in the list and you have adopted the virtualWorkspaces capability, please add a comment in the above issue.
Remote indicator menu
Extensions can now contribute to the remote indicator menu:
The statusBar/remoteIndicator menu contribution point adds a command to the remote indicator menu.
"contributes": {
    "menus": {
        "statusBar/remoteIndicator": [
        {
          "command": "remote-wsl.newWindow",
          "when": "!remoteName && isWindows",
          "group": "remote_10_wsl_0_local@1"
        }
    ]},
    "commands": [
      {
        "command": "remote-wsl.newWindow",
        "title": "New WSL Window",
        "category": "Remote-WSL"
      }
    ]
}
To allow the menu to sort entries based on the provider, the group needs to follow a specific syntax:
For commands from remotes: remote_${orderOfGroups}_${remoteName)_${internalGrouping}@${orderInGroup}
For commands from virtual file systems: virtualfs_${orderOfGroups}_${fileScheme)_${internalGrouping}@${orderInGroup}
orderOfGroupsis a 2-digit number used to sort the groupsremoteNameis first part of the remoteAuthority (wsl, ssh,...)fileSchemeis the URI schema of the virtual file systeminternalGroupingis of free use for each contributionorderInGroupis used to sort entries within your group
Example: remote_10_wsl_1-open@1
iframes now used for most webviews
Ever since the webview API was first introduced, we've implemented webview using Electron's webview tag. On the web however, VS Code's webviews are instead implemented using standard <iframe> elements since <webview> is not available.
We've been exploring migrating desktop versions of VS Code to use <iframe> backed webviews for a while, as this change will give extensions a more consistent webview environment between desktop and web. Migrating off of <webview> will also help with our Electron sandboxing efforts.
This iteration, we have switched the majority of webviews over to use iframes. The <webview> tag is now only used for webviews that enable the Find widget, and we plan on migrating them to use iframes as well after a bit more engineering work.
This change should not cause issues, however there are some corner cases where the behavior of <iframe> and <webview> elements differ. Be sure to give your extension a quick test pass to verify that everything works as expected.
Easier inspecting of webviews
One clear benefit of <iframe>-backed webviews is that they are now much easier to inspect.
If you've worked with webviews previously, you may remember that you had to use the Developer: Open Webview Developer Tools command to inspect the contents of your webview. This would open a new developer tools panel just for your webview.
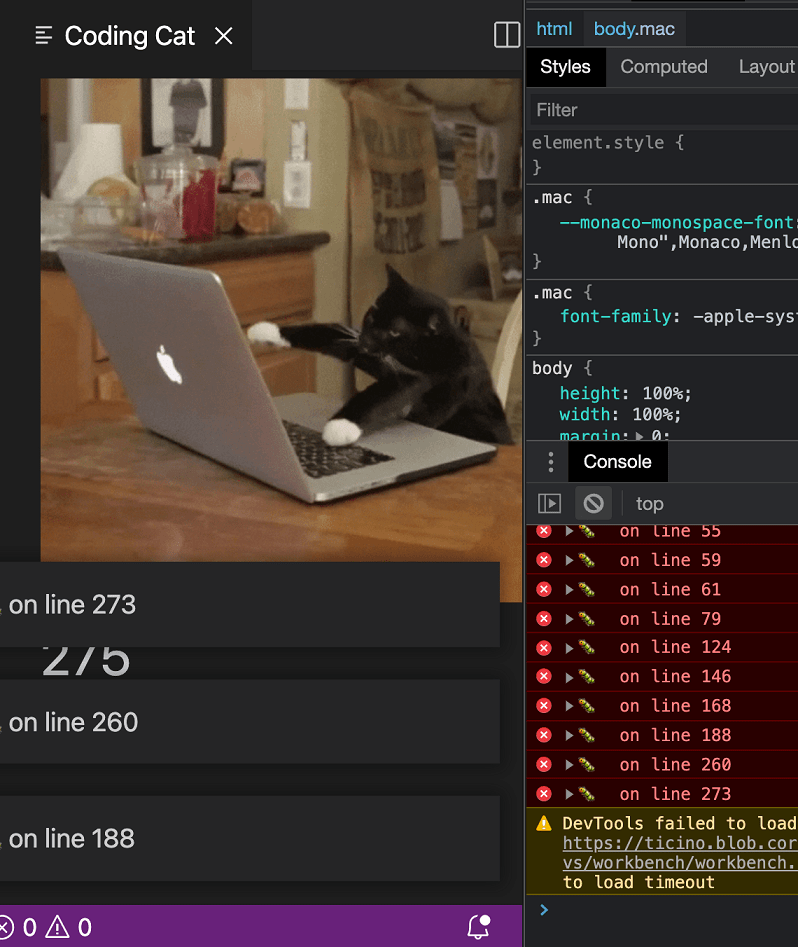
With <iframe>-backed webviews, you can instead use VS Code's standard developer tools (Developer: Toggle Developer Tools) to inspect webviews.
This makes it easy to inspect multiple webviews. The developer tools also no longer close when your webview goes away.
In addition, exceptions and console messages that occur inside of webviews are now printed in the top-level developer tools console.
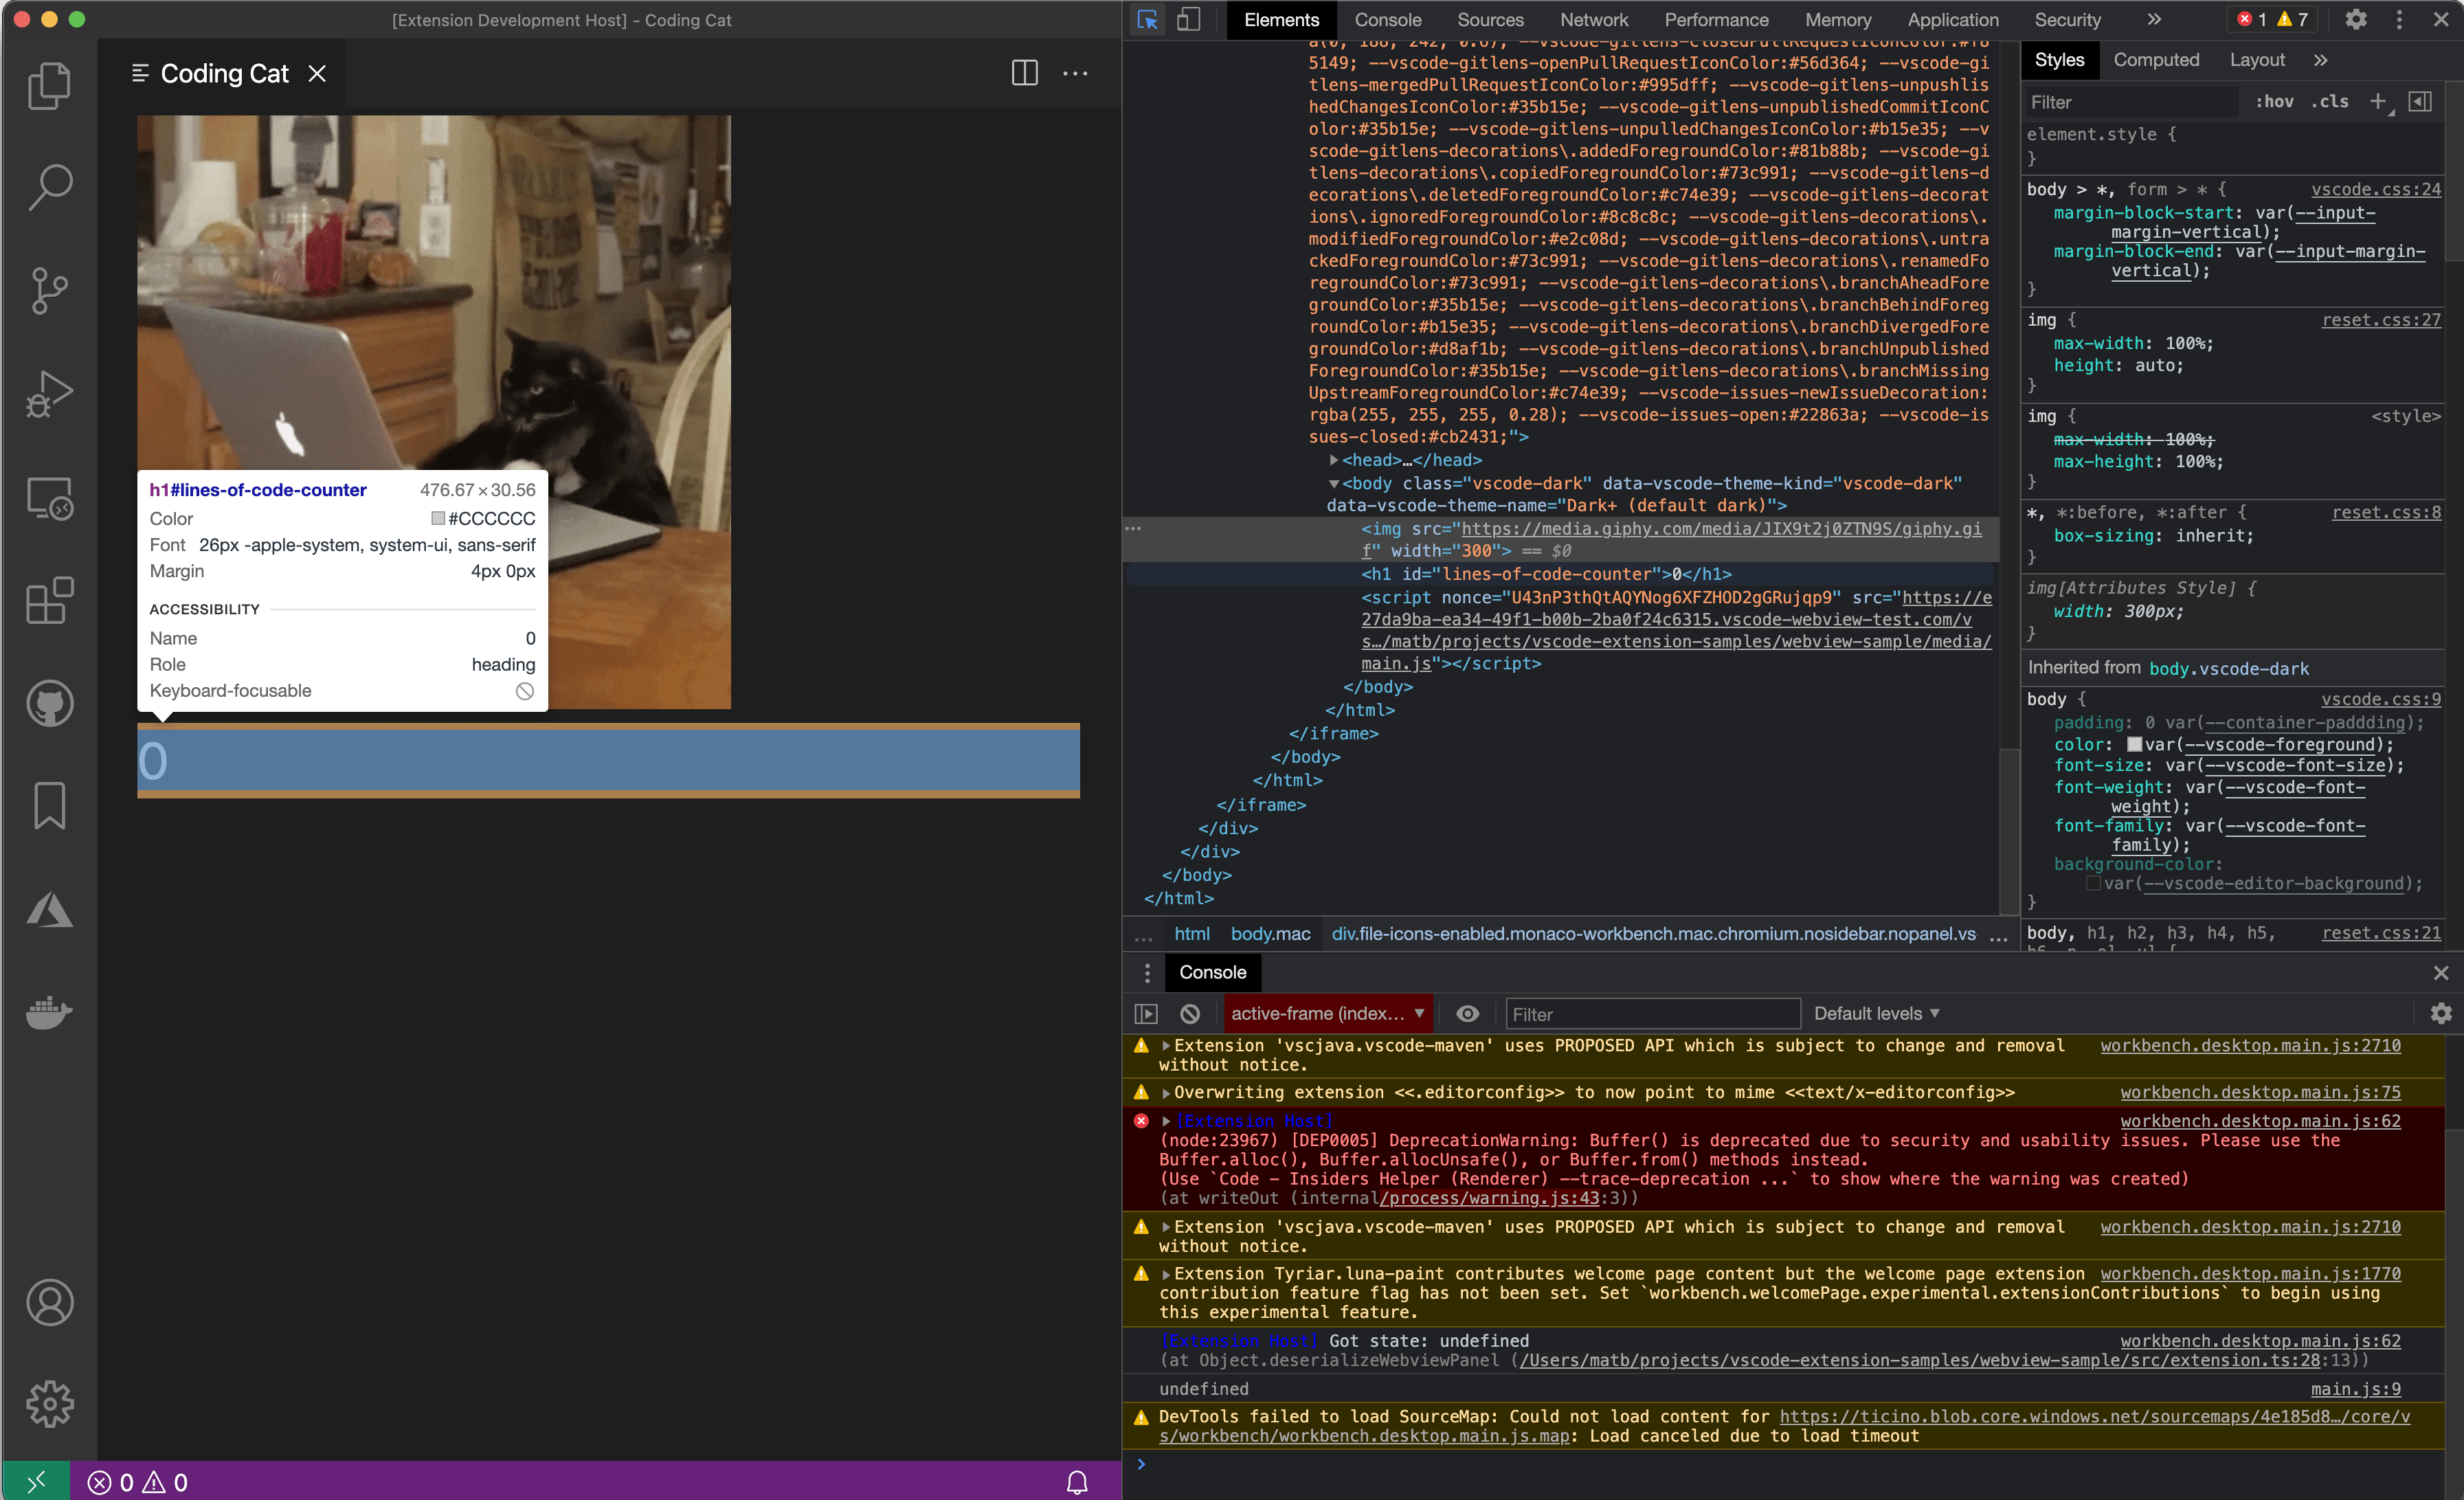
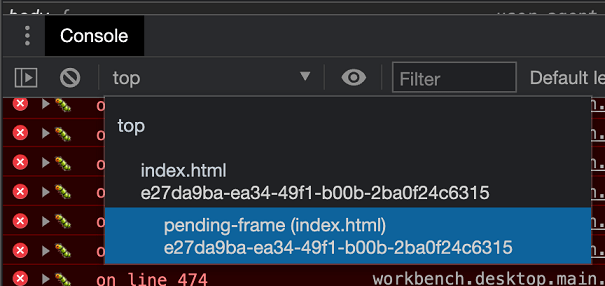
You can also use the developer tools to evaluate expressions in a webview's context. After opening VS Code's dev tools with Developer: Toggle Developer Tools, open the console, and select the active-frame for your webview from the context selector.
Overall, being able to use VS Code's standard developer tools should provide a nicer development experience for webviews.
CodeActionTriggerKind
The new triggerKind property on CodeActionContext tracks why Code Actions are being requested from a CodeActionProvider. The possible values of this property are:
Invoke- Code Actions were requested explicitly, either with a keyboard shortcut or command.Automatic- Code Actions were requested without explicit user action. This includes requesting Code Actions when the contents of a document change.
Providers can use triggerKind to return different sets of results depending on how Code Actions are requested. For example, a refactoring Code Action provider that is triggered automatically may only return refactorings for the exact current selection in order to limit how often the Code Action lightbulb shows up. However when Code Actions are explicitly requested, the same provider may automatically expand the current selection to try to show all the refactorings that a user may be interested in at the current location.
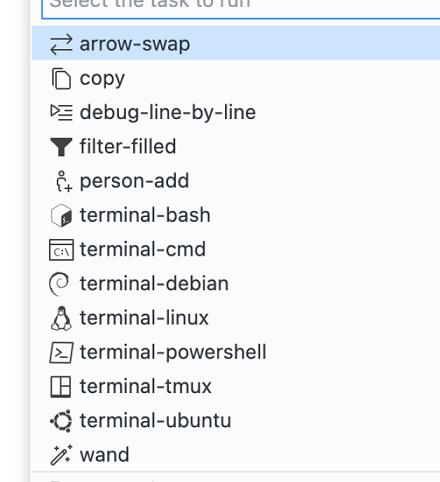
Updated codicons
We've added the following new icons to our codicon library:
arrow-swapcopydebug-line-by-linefilter-filledperson-addterminal-bashterminal-cmdterminal-debianterminal-linuxterminal-powershellterminal-tmuxterminal-ubuntuwand
Keybinding label colors
Keybinding labels are shown when there is a keybinding associated with a command. Usages of the keybinding label include (but are not limited to):
- The Command Palette
- The Keyboard Shortcuts editor
- The Keyboard Shortcuts recorder modal
- The "feature contribution" section of an extension's marketplace page
The following customizations are available:
keybindingLabel.background: Keybinding label background color. The keybinding label is used to represent a keyboard shortcut.keybindingLabel.foreground: Keybinding label foreground color. The keybinding label is used to represent a keyboard shortcut.keybindingLabel.border: Keybinding label border color. The keybinding label is used to represent a keyboard shortcut.keybindingLabel.bottomBorder: Keybinding label border bottom color. The keybinding label is used to represent a keyboard shortcut.
Workspace Trust extension API
Last milestone, we mentioned the work we had been doing on a feature called Workspace Trust. We asked extension authors to keep an eye on issue #120251 for updates and we continue to do so. The following information and updates can be found in that issue as well.
This milestone we moved the Workspace Trust extension API from proposed to stable. This allowed us to release the first cut of our guide for onboarding your extension to Workspace Trust. The API is small, so here is a quick look.
You can declare your extension to provide complete or partial or no support in untrusted workspaces using the untrustedWorkspaces capability in package.json.
The following example declares that the extension is supported completely in untrusted workspaces. In this case, the extension is enabled in untrusted workspaces.
"capabilities": {
  "untrustedWorkspaces": {
    "supported": true
  }
}
The next example declares that the extension is not supported in untrusted workspaces. In this case, the extension is disabled in untrusted workspaces.
"capabilities": {
  "untrustedWorkspaces": {
    "supported": false
  }
}
The third option is to declared limited support. There are three tools provided to you when you select the limited option.
First, if you have a setting that can be configured in the workspace but requires the workspace to be trusted in order to apply the workspace value, then you can include the setting using restrictedConfigurations array property in untrustedWorkspaces object. Doing so, VS Code will ignore the workspace value of these restricted settings when your extension reads these settings values using the VS Code Workspace Configuration API.
The following example declares the settings that are restricted in untrusted workspaces.
"capabilities": {
  "untrustedWorkspaces": {
    "supported": "limited",
    "restrictedConfigurations": [
      "markdown.styles"
    ]
  }
}
Next, you can also check and listen if the current workspace is trusted or not programmatically using the following API:
export namespace workspace {
  /**
   * When true, the user has explicitly trusted the contents of the workspace.
   */
  export const isTrusted: boolean;
  /**
   * Event that fires when the current workspace has been trusted.
   */
  export const onDidGrantWorkspaceTrust: Event<void>;
}
Lastly, you can hide commands or views declaratively with the isWorkspaceTrusted context key in your when clauses.
Call to Action: Please review the "Workspace Trust Extension Guide" in issue #120251 and set the untrustedWorkspaces.supported value as appropriate for your extension.
Proposed extension APIs
Every milestone comes with new proposed APIs and extension authors can try them out. As always, we want your feedback. This is what you have to do to try out a proposed API:
- You must use Insiders because proposed APIs change frequently.
- You must have this line in the
package.jsonfile of your extension:"enableProposedApi": true. - Copy the latest version of the vscode.proposed.d.ts file into your project's source location.
You cannot publish an extension that uses a proposed API. There may be breaking changes in the next release and we never want to break existing extensions.
Native notebooks
We are preparing large parts of the native notebook API for finalization. We have done numerous little tweaks and also some major changes.
Notebook serializer
We added the NotebookSerializer API. It provides a simplified way to translate "bytes" into NotebookData and vice versa. When you implement this API, your notebook will get features like backup, revert, dirty-state, and others for free. We recommend extension authors adopt this new API and not use the previous content provider-based API.
Notebook controller
The notebook controller API replaces the kernel provider API. Notebook controllers provide the execution engine of your notebook, which create the notebook output. Notebooks can provide multiple controllers or none and VS Code allows users to select controllers. In return, extensions are free to create, modify, and remove controllers as their domain model demands.
Notebook cell Status bar
The NotebookCellStatusBarItemProvider API replaces the createCellStatusBarItem method. It enables extensions to contribute items with labels, icons, and commands, to the Status bar at the bottom of every cell editor. It follows the same provider pattern as many other VS Code extension APIs.
Testing
We intended to finalize a subset of the new testing APIs this month, however we focused on refinement and deferred finalization to next month, tracked in issue #122208. API changes made this iteration were primarily:
- The
TestProviderwas renamed to theTestControllerand its methods were renamed accordingly. - The
TestItems are now managed objects called byvscode.test.createTestItem. - Test results are now created through a standard
vscode.test.createTestResultsmethod, which can be called within or outside ofTestController.runTests.
With these changes came a few additional features, such as the ability to display raw test output and for extensions to indicate errors in loading tests. We believe these changes provide a solid foundation for additional capabilities going forward and align more closely to our existing extension APIs.
We also created a Test Adapter Converter extension that allows any adapter working with the existing Test Explorer UI extension to automatically plug into native VS Code testing. The converter extension can be installed manually today, and soon it will integrate with the Test Explorer UI for a seamless migration path for existing users and adapters into native testing.
Improved transfer of ArrayBuffers to and from webviews
In current versions of VS Code, sending typed arrays to or from a webview has a few quirks:
- Typed arrays, such as
UInt8Array, serialize very inefficiently. This can cause performance issues when you need to transfer many megabytes of data. - Sent typed arrays are not recreated as the correct type on the receiving side. If you send a
UInt8Array, the receiver instead gets a generic object that has the data values of theUInt8Array.
While both of these issues are bugs, we also can't fix them without potentially breaking extensions that rely on the existing behavior. At the same time, there's zero reason a newly written extension would want the current confusing and inefficient behavior.
Therefore, we've decided to leave the existing behavior in place for existing extensions but opt new extensions into the more correct behavior. This is done by looking at the engines in your extension's package.json.
"engines": {
  "vscode": "^1.57.0",
}
If the extension targets VS Code 1.57+, then typed arrays should be recreated on the receiver side and the transfer of large typed arrays to and from webviews should be much more efficient.
Please test out this behavior and let us know if it either doesn't work as expect or causes unexpected regressions for your existing code.
TerminalOptions.message
This new proposal allows an extension to display a message in the terminal before the process is launched.
vscode.window.createTerminal({
  message: '\x1b[3;1mSome custom message\x1b[0m'
});
Debug Adapter Protocol
Exception breakpoints are better aligned with regular breakpoints
The setExceptionBreakpoints request can now optionally return an array of Breakpoints similar to other set*Breakpoints requests. This allows clients to show validation error messages for individual exception breakpoints or filters. Starting with this release, VS Code shows these errors in the Breakpoints view.
Restart request can now pick up debug configuration changes
The restart request now takes a new optional parameter arguments, where clients can pass the latest version of a launch or attach configuration. With this addition, a debug adapter can restart the session with up-to-date values from the debug configuration.
Disconnect debugger and keep debuggee suspended
The disconnect request is used to end a debug session and to either continue execution of the debuggee or to terminate it. There is a new option to keep the debuggee in the suspended state after the debugger disconnects. This makes it possible to pick up debugging with a new session.
A debug adapter implementing this feature must announce its support with the supportSuspendDebuggee capability. A client can use the feature by passing a new optional argument suspendDebuggee to the disconnect request.
Engineering
Electron 12 update
In this milestone, we finished the exploration to bundle Electron 12 into VS Code, thanks to everyone involved with testing and self-hosting on Insiders. This is a major Electron release and comes with Chromium 89.0.4389.114 and Node.js 14.16.0.
Progress on Electron sandbox
This milestone we continued to make the VS Code window ready for enabling Electron's sandbox and context isolation features.
Specifically:
- We changed all of the environmental properties needed for a VS Code window to be accessible in a sandboxed renderer.
- We are exploring switching to
iframeelements instead ofwebviewfor custom editors by selectively enabling theiframein certain cases where possible. - We were able to move some of the native module or Node.js requirements we have in the renderer to other processes or remove them entirely.
- We made
windows-process-treecontext-aware.
Service workers now used to load resource in webview
In desktop VS Code, webviews now use service workers to load local resources. Web versions of VS Code have always used service workers for this, but previously desktop VS Code was using an Electron protocol.
Using service workers in the desktop version, lets us better align the behavior of webviews between desktop and web. It also helped us fix a few tricky bugs and let us delete around 1000 lines of code.
While this change should have no impact on the majority of webview extensions, it could cause problems in a few edge cases:
-
Extensions that make assumptions about how webviews load resources
If your extension was using the
vscode-webview-resource:protocol directly or hard coding other assumptions about resource URIs, it may no longer work.Instead, make sure you always use
.asWebviewUrito create URIs for resources. Also remember that the format of the returned URI may chance in the future. -
Extensions that set the
srcof an iframe to point to an HTML file on diskService workers cannot not see this request so we no longer support this. This was already the case on web, and we don't think this pattern is common.
The recommended fix is to not use an iframe and to inline the contents of the HTML file into the webview instead.
No implicit override enabled in codebase
The upcoming TypeScript 4.3 release a new override keyword which tells the compiler that a method in a subclass overrides a method in its superclass. There's also a new --noImplicitOverride flag that enforces that all methods that override a method from a superclass must use the override keyword:
class Foo {
   foo() {...}
}

class SubFoo extends Foo {
    foo() { ... } // Error when noImplicitOverride is enabled: missing override specifier
}
The override keyword has a few benefits:
-
When reading code, it alerts you that a method is overriding one from the base class
-
It is an error to try to override a method that does not exist on the base class. This can help catch errors caused by renaming a method in a base class but forgetting to update the method name in the subclasses.
This iteration we adopted the override keyword in our codebase and also enabled --noImplicitOverride for both core VS Code and all builtin extensions. While we automated the majority of this work, the change did help us catch a few cases where our code was incorrectly re-declaring a property or had unclear inheritance patterns.
This new strictness rule should also help us catch some common programming mistakes in the future.
Windows installers consolidated in Windows Package Manager
We have updated our Windows Package Manager publishing pipeline to publish our user and system installers for arm64, and to adopt the v1 package manifest schema, allowing us to consolidate the user and system installers for x86, x64 and arm64 into a single manifest. Users can pick between the user and system installers using the --scope parameter when installing a package or using the winget CLI settings.
Documentation
Updated introductory videos
The VS Code introductory videos have been updated. The videos range from Getting Started and Using extensions to VS Code features like Debugging and Version Control.
New C++ videos
The C++ extension team has created a set of introductory videos explaining how to configure IntelliSense, build, and debug your C++ projects.
The Story and Technology Behind VS Code
You can read about the history and underlying technology of VS Code in this interview with VS Code engineer, Ben Pasero. Ben talks about the early days of VS Code and what it's like to use Electron as an application framework enabling VS Code run on macOS, Windows, and Linux.
Partner extensions
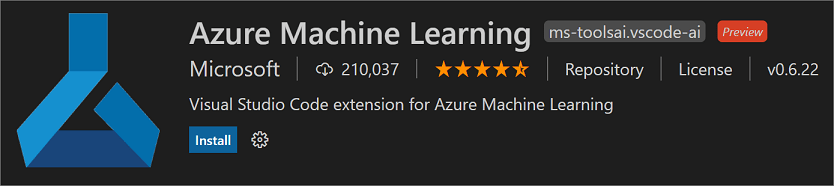
Azure Machine Learning
The Azure Machine Learning extension enables you to create and manage powerful cloud computing resources for your machine learning workflows. With its remote capabilities, you can seamlessly connect to your compute resources in a secure, auditable, and compliant manner.
Notable fixes
- 108559: RunInTerminal doesn't use the specified integrated terminal from workspace settings bug
- 118282: Debugger Step Over into skipFiles
- 118731: Investigate how to avoid Safari's popup-blocker when opening browser windows and tabs asynchronously
- 119340: Run Without Debug never terminates if uncaught exceptions breakpoint is enabled
- 121347: File gets garbled characters when restored from backup
- 119059: Custom text editors: backups open 2 editors when restoring
- 120245: CSS:
!importantcompletion is broken - 120393: Improve handling of webgl context loss
- 120435: Remove
emmet.extensionsPathvalid path check - 120882: Pasting file in the explorer no longer opens that file in the editor
- 121148: Duplicate launch configuration are shown in debug dropdown
- 120277: The horizontal scroll bar in the Find in Files pane is too small and scrolls the wrong way
Thank you
Last but certainly not least, a big Thank You to the following people who contributed this month to VS Code:
Contributions to our issue tracking:
- John Murray (@gjsjohnmurray)
- Andrii Dieiev (@IllusionMH)
- Don Jayamanne (@DonJayamanne)
- Simon Chan (@yume-chan)
- T.Y.M.SAI (@tymsai)
- ArturoDent (@ArturoDent)
- Alexander (@usernamehw)
Contributions to vscode:
- @akosyakov (Anton Kosyakov): fix race between terminal create and initial resize PR #121272
- @alanrenmsft (Alan Ren): fix issue with finding required node handles PR #118091
- @alexmyczko (Alex Myczko): Improve debian control description PR #119160
- @aliasliao (Liao Jinyuan): fix emmet issue where wrong suggestions is promoted in html file PR #120480
- @andrewbranch (Andrew Branch)
- [typescript-language-features] Support import statement completions for TypeScript 4.3 PR #119009
- [html-language-features] Update TS language service call for 4.3 protocol PR #120362
- [typescript-language-features] Add telemetry for import statement completions PR #121243
- Fix missed Previewer.plain call due to adjacent @ts-expect-error PR #121975
- @anthony-c-martin (Anthony Martin): Update seti-ui file icons PR #119468
- @arnobl (arno): fix(notebook): redo cell creation does not re-select the cell PR #120086
- @awilkins (Adrian Wilkins): Implement selection paste for integrated terminal on Linux PR #108397
- @benmccann (Ben McCann): Fix issue number in comment PR #121758
- @bourdakos1 (Nick Bourdakos): Update seti icons PR #120938
- @CanadaHonk
- [themes] Fix JSON formatting in High Contrast Black default theme PR #120761
- [themes] Fix JSON formatting in High Contrast Black default theme (2) PR #120815
- [themes] Fix JSON formatting in High Contrast Black default theme (3) PR #120841
- @conwnet (netcon): fix: only add readonly attribute to textarea dom when editor is readonly PR #120503
- @gjsjohnmurray (John Murray)
- fix #120485 hide
Open Timelinefrom Explorer context menu when there are no timeline providers PR #120497 - fix-120578 don't offer callstack step-in/over/out when not stopped PR #120581
- fix #121509 documentation error for two API command results PR #121511
- fix #120485 hide
- @hantatsang (Sang)
- markdown-language-features: Fix Windows Preview Link Uri PR #120090
- Add emmet self closing abbreviation support PR #120311
- @jeanp413 (Jean Pierre)
- Fix emmet completions in scss PR #118666
- Fix problems pane ignores
files.excludeoption PR #119040 - Fixes simple browser icons are broken in firefox PR #120275
- Fixes horizontal scrollbar is too narrow in split settings editor JSON PR #121027
- Fix regression cannot preview image with special characters '#', '%' or '?' PR #121874
- @Jolg42 (Joël Galeran): Refactor npm extension to only use npm PR #120317
- @joyceerhl (Joyce Er): Add missing padding-bottom for notebook markdown cells PR #122505
- @KapitanOczywisty: Update PHP grammar PR #120339
- @Kingwl (Wenlu Wang): Add next/prev conflicts PR #97613
- @leemun1 (Mike Lee): feat: add support for additional surrounding pairs for markdown (#_119982) PR #121698
- @lf- (Jade): Improve reporting of extension config schema validation errors PR #120457
- @limitedmage (Juliana Peña): Fix race condition in showing and hiding suggestWidget PR #121396
- @LuisPeregrinaIBM2: wsl -l -q, removes header and default mark PR #120382
- @nan0tube (Yongming Lai): Recognise commonly sourced files as shellscript PR #121373
- @plainerman (Michael Plainer): Add support to deactivate auto-updating disabled extensions PR #113155
- @PooyaZv (Pooya Vakeely): Add cuda-cpp lang id, grammar and problem matchers PR #119444
- @qchateau (Quentin Chateau): format modified: format lines with whitespace changes PR #119021
- @sdegutis (Steven Degutis): Make error message clearer PR #121339
- @sokolovstas (Stanislav): Fix file location pattern in eslint-stylish problem matcher PR #117576
- @solomatov (Konstantin Solomatov): Terminate in case of ext host IPC timeout PR #122399
- @stoyannk (Stoyan Nikolov): Fixed wrong variable name shadowing that caused Profiles for extensio… PR #120054
- @timmaffett (Tim Maffett): Fixed and extended Debug Console support for most ANSI SGR codes PR #120891
- @vinku: Emmet: Select next/previous item does not work with script tag. PR #118842
- @wdesgardin (William Desgardin): feat: add typographer option for markdown preview PR #119641
- @yannickowow (Yanis HAMITI): Show current DataBreakpoint access type in "Breakpoints" view (#_119588) PR #119817
Contributions to vscode-eslint:
- @JoshuaKGoldberg (Josh Goldberg): Implement eslint.rules.customizations - with overrides PR #1164
Contributions to vscode-json-languageservice:
- @KapitanOczywisty
- @mifieldxu (Mifield): improved glob matching using minimatch PR #93
- @ssbarnea (Sorin Sbarnea): Upgrade dependencies PR #95
Contributions to vscode-vsce:
Contributions to debug-adapter-protocol:
- @jarpoole (Jared Poole): ESP-IDF debug adapter PR #190
- @vadimcn: Add a direct reference to JSON schema PR #185
Contributions to vscode-js-debug:
- @millerds (Darren Miller): String support chakracore PR #979
- @swissmanu (Manuel Alabor): CDP Proxy: Allows Other Extensions to Reuse CDP Connection PR #964
Contributions to vscode-generator-code:
- @felipecrs (Felipe Santos): Hide dist folder from search results PR #260
- @miles-crighton (Miles Crighton): fix: Update token inspection command PR #249
- @noah-vdv (Noah van der Veer): fix 'orther' typo on line 162 PR #255