What's new for Chrome debugging
December 20, 2017 by Kenneth Auchenberg
Over the recent months, we have been busy improving the Chrome debugging experience for Visual Studio Code, and today we are happy to release three new features that we think will make client-side JavaScript debugging in VS Code easier and more reliable.
If you aren't familiar with the Microsoft Debugger for Chrome extension, it allows you to debug your client-side JavaScript running in Google Chrome. This adds a new aspect to VS Code's existing JavaScript debugging experience, where out-of-the-box you can debug your server-side JavaScript in Node.js. Having both debuggers installed allows you to do seamless full-stack JavaScript debugging.
Use VS Code and Chrome DevTools at the same time!
The first thing we have been working on with the Google Chrome team is to make it possible to use both VS Code and Chrome DevTools at the same time!
This has been a user request since day one, but we were limited by Chrome's lack of support for multi remote debugging connections. This meant that when VS Code connected to Chrome, their Chrome DevTools would be kicked out, and when you opened Chrome DevTools, VS Code would be kicked out.
Multiple connections means that you now can debug your JavaScript from VS Code while using the DOM Explorer, profiler or any other tool inside Chrome DevTools, without getting disconnected!
The Chrome team began working on this a few months ago, and we have been working closely with them to make sure the VS Code experience is optimal. Multi-connections shipped officially in Chrome 63, and works out-of-the-box with VS Code. To get multi-connection support, update to the latest Chrome version, and you should be good to go.
Synchronized stepping between Chrome DevTools and VS Code
We think being able to combine VS Code and Chrome DevTools is an extremely powerful experience. It enables you to pick the right tool for the scenario, without being forced to make the hard choice of replacing one tool with another. VS Code lets you debug JavaScript in your editor, but we also recognize that some users prefer to debug JavaScript from DevTools, so instead of trying to replace DevTools, we instead see this as an opportunity to integrate.
The first step towards better integrating the tools is synchronized stepping between Chrome DevTools and VS Code, as shown here:
Synchronized stepping allows you to debug your JavaScript source code in VS Code and Chrome DevTools at the same time, and gives you the opportunity to seamlessly jump between the two tools. From within each tool, you can step-in, continue, and debug your JavaScript without worrying about the other debugger getting out of sync.
It's still early days and we are excited to explore the new world of integration that's possible with connected editors and DevTools.
Localized debugging UI
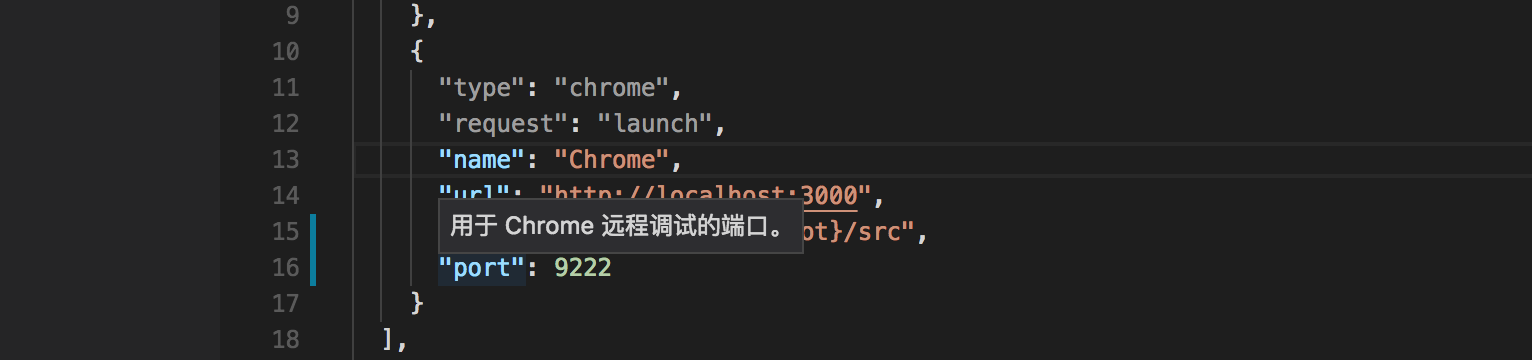
In this release we have also enabled localization of core parts of our debugger, which means that features such as break on uncaught exceptions and property descriptions in our launch.json now are localized and available for our supported languages, such as Chinese.
Breakpoints set before your app runs
Another feature we have been working on with our friends in Visual Studio is the ability for us to set breakpoints in JavaScript before it gets executed in Chrome. This sounds very simple, but is quite complicated when you dive into the details of how JavaScript can be loaded and executed asynchronously.
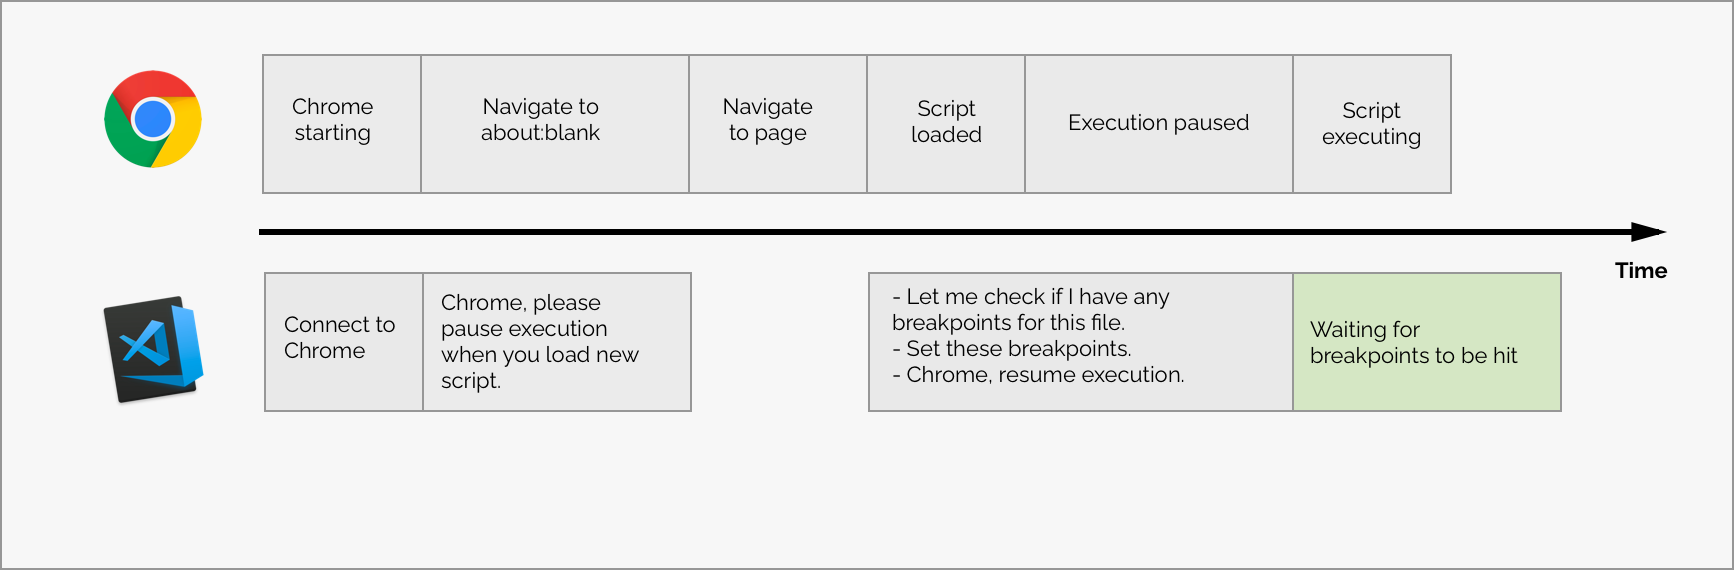
Many users have had the experience that their breakpoints aren't hit when launching Chrome. To add to their confusion, their breakpoints are hit after a simple page refresh. Why would that be? It's a bit complicated, but it comes down to a timing issue between VS Code and Chrome, which is best illustrated in a timeline:
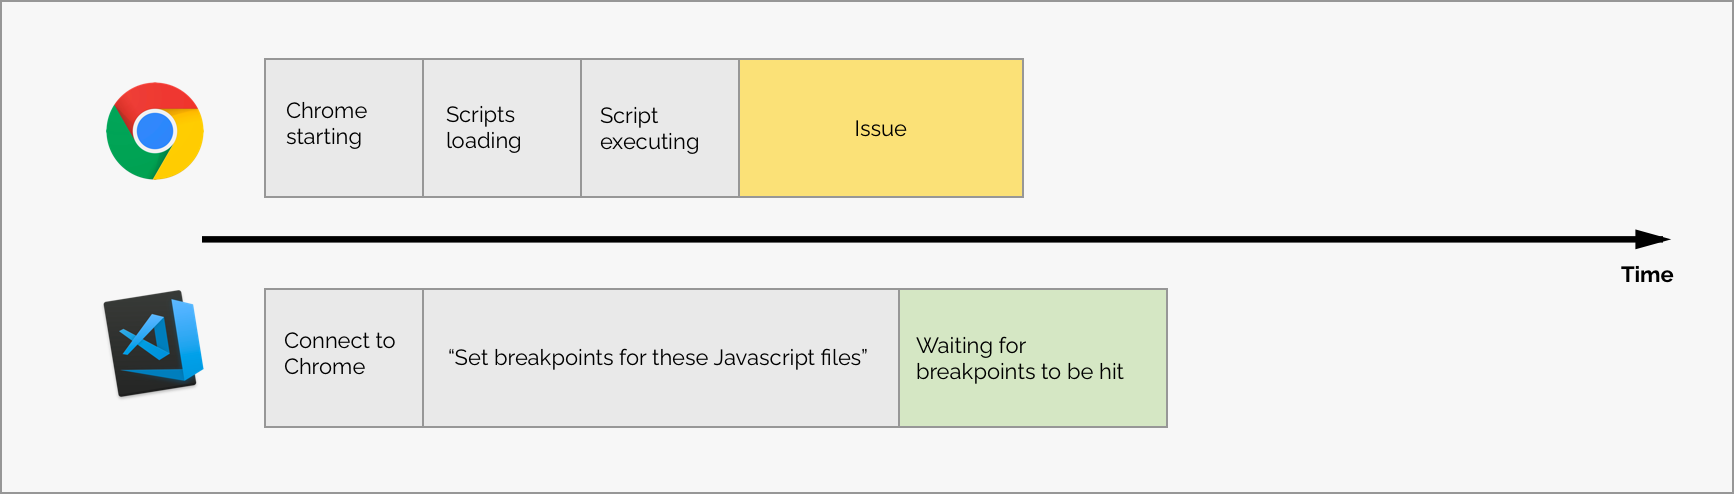
As you can see on the timeline in yellow, the issue is that some JavaScript is executed before VS Code sets the breakpoints.
This means that if you have breakpoints in source code that would get immediately executed as a part of a page load, VS Code hasn't been able to set the breakpoints before execution had completed. The workaround is to do a page refresh which re-executes the code and therefore triggers the breakpoint.
Good news! We have found a way where you reliably can set breakpoints in early executed source code, which we call break-on-load breakpoints.
Break-on-load breakpoints are powered by DOM Instrumentation Breakpoints in Chrome that allow us to pause script execution every time a new script is loaded. This changes the workflow for our debugger, and allows us to have more time to set breakpoints before your JavaScript is executed.
Enable break-on-load
We are releasing break-on-load breakpoints as an experimental feature for our Chrome Debugger, and you can enable the feature by setting the new breakOnLoad property to true in your launch.json configuration:
{
  "type": "chrome",
  "request": "launch",
  "name": "Chrome",
  "url": "http://localhost:3000",
  "webRoot": "${workspaceRoot}/src",
  "breakOnLoad": true
}
Enabling break-on-load breakpoints will have an impact on your initial page load performance, as the debugger briefly pauses Chrome every time a new script is loaded. For that reason, this is currently an opt-in feature. If you are experiencing missing breakpoints, try enabling break-on-load breakpoints and let us know how they work for you.
That's it for now. It's a big update for our Chrome debugger, and we can't wait to hear your feedback on these new features. In a world where your editor is more integrated with DevTools, let us know what you would expect or want from your tools.
Happy Coding!
Kenneth (@auchenberg)