Introducing Chrome Debugging for VS Code
February 23, 2016 by Andy Sterland and Kenneth Auchenberg
Since the first release of Visual Studio Code, one of our focuses has been to simplify the daily workflow for developers by enabling them to debug their code directly from the editor. We started out with .NET and Node.js debugging, and today we are taking the next step by introducing our Chrome Debugger for Visual Studio Code.
Our Chrome Debugger allows front-end developers to debug their client-side JavaScript code running inside Google Chrome directly from Visual Studio Code.
How does it work?
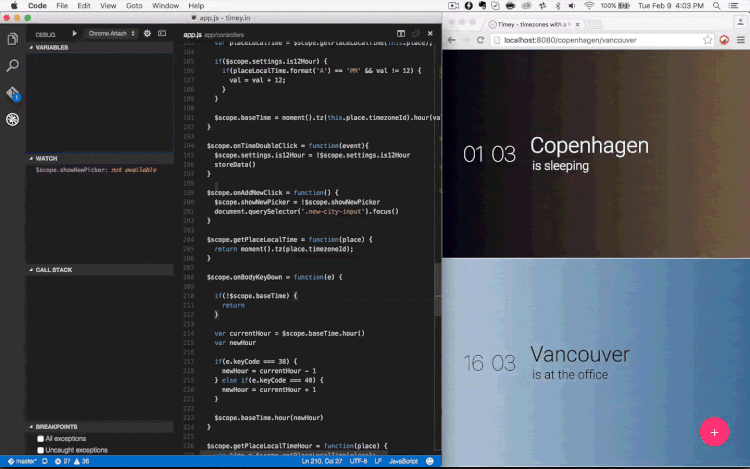
Our debugger works by connecting to Chrome over its Chrome Debugger protocol, where we map files loaded in the browser to the files open in Visual Studio Code. This means developers now can set breakpoints directly in their source code, set up variables to watch and see the full call stack when debugging — all without leaving the editor.
In the above example, we are showing an AngularJS app bundled and minified via Browserify being debugged from VS Code. This works because our debugger understands JavaScript Source Maps, which we’ll use to enable developers to debug straight from their original source, and not the transpiled result that the browser sees. Supporting source maps also enables debugging of TypeScript straight from VS Code.
For now, Chrome needs to be started with remote debugging enabled, and only supports one concurrent connection. This means if you open up DevTools inside Chrome, the connection to VS Code will get terminated by Chrome. This is slightly annoying, and we hope this issue will be fixed sometime soon.
To get started
To get started, open the Extensions view (⇧⌘X (Windows, Linux Ctrl+Shift+X)). When the extension list appears, type 'chrome' to filter the list and install the Debugger for Chrome extension. You'll then create a launch-configuration file which we explain in detail in our README right here.
You can either setup VS Code to connect to an already running Chrome instance or simply start a new one with remote debugging enabled, but read more about that in our README.
Supported features
In this first release, we support the following features:
- Setting breakpoints, including within source files when source maps are enabled
- TypeScript, via source maps
- Stepping, including using the buttons on the Chrome page
- Locals scope variables via the VS Code Locals pane
- Debugging eval scripts, script tags, and scripts that are added dynamically
- Watches via the VS Code Watch panel.
- The debug console
- Most console APIs
Going forward
We believe there’s much to be done for front-end developers, as building for the web in the recent years has become incredibly complex. With our Chrome debugger, we are taking the first step towards a simpler web development workflow, where browsers and tooling from different vendors are able to work together, and building for the web feels more integrated.
We’ve released this extension on GitHub as an MIT licensed open-source project. It’s a work in progress, so see our issues page for known bugs – for example, we have a few issues around supporting all flavors of generated source maps.
For now we support Google Chrome, but we’re also looking at expanding our support to Microsoft Edge and other browsers. We really want your feedback and help to build an even better debugging experience.
If you have any issues or ideas for improvements, feel free to reach out to us on Twitter or GitHub.
–
Andy Sterland, Senior Program Manager, JavaScript Diagnostics
Kenneth Auchenberg, Program Manager, JavaScript Diagnostics