January 2020 (version 1.42)
Update 1.42.1: The update addresses these issues.
Downloads: Windows: x64 | Mac: Intel | Linux: deb rpm tarball snap
Welcome to the January 2020 release of Visual Studio Code. There are a number of updates in this version that we hope you will like, some of the key highlights include:
- Rename preview - See pending renames in a diff view and easily accept or reject changes.
- Open editors limit - Set the maximum number of editors open at one time.
- Panel placement - Move the panel (Output, Terminal) to the left, right, or below the editor.
- Folded code highlighting - Quickly find folded regions with new background highlight.
- Debug Console improvements - Syntax highlighting, bracket matching, input history.
- Define global tasks - Per user tasks can be used across all your folders and workspaces.
- Java extension updates - Java support for Data Breakpoints and Call Hierarchy view.
- Remote Development - New Forwarded Ports view for mapping SSH and Containers ports.
- New Containers tutorials - Learn how to create and deploy Docker containers.
- Preview features - First looks at the Timeline view, Search editor, semantic highlighting, and more.
If you'd like to read these release notes online, go to Updates on code.visualstudio.com.
Insiders: Want to see new features as soon as possible? You can download the nightly Insiders build and try the latest updates as soon as they are available. And for the latest Visual Studio Code news, updates, and content, follow us on Twitter @code!
Workbench
Rename preview
Visual Studio Code now allows you to preview Rename changes. When renaming, you can confirm a new name via ⌘Enter (Windows, Linux Ctrl+Enter) and see the Refactor Preview panel. It displays pending changes in a diff editor and allows you to uncheck/check individual changes. Once the rename has been applied (or aborted), the diff editor and preview panel close, putting you back in the current editor.
Theme: GitHub Sharp, Font: FiraCode
Limit the number of open editors
There are new settings to limit the maximum number of editors that are open at the one time.
workbench.editor.limit.enabled: Enable this feature (off by default).workbench.editor.limit.perEditorGroup: Whether to apply the limit per editor group or across all groups.workbench.editor.limit.value: The maximum number of open editors (10 by default).
If enabled, VS Code will close the least recently used editor when you open a new editor.
Below you can see the behavior when the limit is set to 3:

Theme: Nord
Note: Dirty editors (files with unsaved changes) are never automatically closed but still count in the total number of open editors.
Untitled editor improvements
Untitled editors in VS Code are text buffers that have not yet been saved to disk. You can leave them open for as long as you like and all text content is stored and restored between restarts.
Untitled editor titles
In the past, untitled editors were given generic names such as Untitled-1, counting upwards. In this release, untitled editors will use the content of the first line of the document for the editor title and include the generic name as the description:
Theme: Nord
Note: If the first line is empty or does not contain any words, the title will fall back to Untitled-* as before.
Default language mode
By default, untitled files do not have a specific language mode configured. VS Code has a setting, files.defaultLanguage, to configure a default language for untitled files. With this release, the setting can take a new value {activeEditorLanguage} that will dynamically use the language mode of the currently active editor instead of a fixed default.
In addition, when you copy and paste text into an untitled editor, VS Code will now automatically change the language mode of the untitled editor if the text was copied from a VS Code editor:
Theme: One Dark Pro
Note: If the untitled editor already has a language mode specified, pasting text will not change it.
Navigate most recently used editors
With this release, there is now a list of most recently used (MRU) editors across all editor groups. An editor is considered recently used when it either opens as the active editor or becomes the new active editor if already opened. Once an editor is closed, it is removed from this list.
One application of this list is the new edt mru picker that you can open through the new View: Show All Editors By Most Recently Used (workbench.action.showAllEditorsByMostRecentlyUsed) command:

You can add keyboard shortcuts to quickly navigate in this picker without using the mouse. For example, below is a keybinding so that Ctrl+Tab and Ctrl+Shift+Tab navigates across editors of all groups (instead of only within the active group as the default keybindings do):
[
  {
    "key": "ctrl+tab",
    "command": "workbench.action.quickOpenPreviousRecentlyUsedEditor",
    "when": "!inEditorsPicker"
  },
  {
    "key": "ctrl+shift+tab",
    "command": "workbench.action.quickOpenLeastRecentlyUsedEditor",
    "when": "!inEditorsPicker"
  }
]
If you want to navigate the list without using a picker, there are new commands:
- View: Open Next Recently Used Editor (
workbench.action.openNextRecentlyUsedEditor) - View: Open Previous Recently Used Editor (
workbench.action.openPreviousRecentlyUsedEditor)
To differentiate which editor navigation commands work with a picker and which ones don't, the behavior of some existing commands has changed. Specifically, the Recently Used Editor in Group commands no longer use a picker:
- View: Open Next Recently Used Editor in Group (
workbench.action.openNextRecentlyUsedEditorInGroup) - View: Open Previous Recently Used Editor in Group (
workbench.action.openPreviousRecentlyUsedEditorInGroup)
For picker-based navigation use:
- View: Quick Open Previous Recently Used Editor in Group (
workbench.action.quickOpenPreviousRecentlyUsedEditorInGroup) - View: Quick Open Least Recently Used Editor in Group (
workbench.action.quickOpenLeastRecentlyUsedEditorInGroup)
Moving the panel
The panel, which holds the Output, Debug Console, Terminal, and Problems panes, can now be moved to the left side of the editor.
The command View: Toggle Panel Position (workbench.action.togglePanelPosition) was removed in favor of the following new commands:
- View: Move Panel Left (
workbench.action.positionPanelLeft) - View: Move Panel Right (
workbench.action.positionPanelRight) - View: Move Panel To Bottom (
workbench.action.positionPanelBottom)
Restore all windows on restart
VS Code's setting for restoring windows on startup has changed to restore all windows by default. If you want to go back to the previous behavior, configure "window.restoreWindows": "one" to only open a single window.
Save conflict resolution
VS Code has a built-in mechanism to show a notification when you try to save a dirty file that has been changed outside of VS Code or by another program (for example Git):

The motivation is to inform you that saving will overwrite the contents on disk even though the file was changed after the file became dirty. Selecting the Compare button lets you review your changes along with the version on disk and either overwrite or revert the file.
In cases where you know that the changes on disk can be overwritten, there is now an Overwrite button directly on the notification. You can also configure files.saveConflictResolution globally, per workspace, or file type to disable this behavior altogether. The options are askUser (default) or overwriteFileOnDisk.
Handling slow save operations
VS Code allows extensions to change a file's contents when saving files to disk. Features like Format on Save and Fix on Save are examples. However, saving is a critical operation and extensions doing processing during a save must finish quickly so that the actual save operation can proceed. "Quickly" used to be enforced by VS Code, where VS Code would cancel extension save operations after a timeout. That enforcement guaranteed speedy saving but could be frustrating because sometimes expected processing would not happen.
With this release, we have given up the timeout-based approach and instead show a progress notification that allows you to cancel extensions participating in save ("Save Participants"). The notification lets you know that save operations are running and you can decide if you want to wait for a save participant to finish or not.

Theme: Light+
Source Control input
The input box in the Source Control view now uses the Monaco Editor. The Monaco Editor supports useful features such as multiple cursors and move/copy line commands.
Two-step collapse in multi-root Explorer
When you are using a multi-root workspace, the Collapse Folder button in the File Explorer now has two-step behavior. The first click will collapse all folders within each top-level, and the second click will collapse the top-level folders. The Search view already has this behavior.

Theme: Monokai
Auto switch Theme based on OS color scheme
Windows and macOS now support light and dark color schemes. There is a new setting, window.autoDetectColorScheme, that instructs VS Code to listen to changes to the OS's color scheme and switch to a matching theme accordingly.
To customize the themes that are used when a color scheme changes, you can set the preferred light and dark theme with the settings:
workbench.preferredLightColorThemeworkbench.preferredDarkColorTheme
Editor
Control Peek view focus
There is a new setting and command to control where the Peek view initially places focus. By default, Peek focuses the tree on the right-hand side so that you can quickly navigate to references. Initial focus on the tree is not best for people wanting to use Peek for making quick code changes in the editor. You can now define your preference with the editor.peekWidgetDefaultFocus setting, which can be set to editor or tree. There is also a new command togglePeekWidgetFocus (⌘K F2 (Windows, Linux Ctrl+K F2)) that allows you to move focus between the Peek editor and tree.
Folded region highlighting
Folded code regions are now easier to discover with the addition of a background highlight.

Theme: Dark+
The feature is controlled by the setting editor.foldingHighlight and the color can be customized with the color editor.foldBackground.
  "workbench.colorCustomizations": {
    "editor.foldBackground": "#355000"
  }
Folding refinements
Shift + Click once on the folding indicator to first fold the inner ranges. Shift + Click again (when all inner ranges are already folded) will fold the parent. Shift + Click again unfolds all.

When using the Fold command (⌥⌘[ (Windows, Linux Ctrl+Shift+[)) on an already folded range, the next unfolded parent range will be folded.
New wrapping option
By default, the editor computes word wrap breaks by assuming that all characters have the same width. This assumption allows the default algorithm to be fast, but its results are poor when using a non-monospace font, or when writing text in a script where characters vary in width. There is a new setting, editor.wrappingStrategy, that can be set to advanced to have the editor delegate word wrap break computation to the browser.
Accessibility
Suggest widget improvements
The suggestions widget now no longer uses ARIA alerts and properly indicates to the screen reader that it is focused. This should prevent the screen reader from accidentally getting in the way.
editor.accessibilityPageSize set to 160 when screen reader detected
The editor.accessibilityPageSize setting controls the number of lines in the editor that can be read out by a screen reader at one time. However, there are performance implications when using a large value. We have decided to automatically set the value to 160 lines when we detect a screen reader (and not more, due to an NVDA bug).
Linux accessibility with Orca
We have started looking into making VS Code accessible on Linux with the Orca screen reader. However, since this work requires Electron 7, we expect to make more progress in the next stable release. In the meantime, for Linux accessibility you can use our Insiders version and provide feedback.
Integrated Terminal
Scrolling sensitivity
The terminal's scrolling sensitivity can now be configured independent of the editor using the new settings:
terminal.integrated.mouseWheelScrollSensitivity- Mouse wheel scrolling multiplier (default is 1).terminal.integrated.fastScrollSensitivity- Fast scroll multiplier when Alt is pressed (default is 5).
Debugging
Simplified initial Debug view
To simplify starting with the Debug view, VS Code now only shows one Run and Debug button. The Run Without Debugging action (which is not supported by all debuggers) is still available in the Debug main menu.
Based on user feedback, the Breakpoints pane is displayed in the starting view, if you have at least one breakpoint set.

Debug Console improvements
Debug Console input
The Debug Console input now uses the language mode of the current active editor. This means that Debug Console input supports syntax coloring, indentation, auto closing of quotes, and other language features.

Input/output presentation
We have tuned the presentation of input and output in the Debug Console to make it more distinguishable. VS Code displays an arrow only next to the input expression.

Debug Console input history suggestions
The Debug Console input box now automatically suggests previously entered entries. The text icon is used to distinguish the history suggestions from other IntelliSense entries.

Hide Debug Console after debugging
There is a new setting debug.console.closeOnEnd that controls whether the Debug Console should automatically close after debugging has stopped.
Support for console.table(...)
The Debug Console can now show output coming from the Node.js console.table(...) API.

Loaded Scripts View improvements
The Loaded Scripts View was updated to use VS Code's new tree view. It now renders single child folders in the same compact form as VS Code's File Explorer. In addition, it is now possible to search and expand the tree as you type:

We are planning to remove the Debug: Open Loaded Scripts command in the next release because it duplicates the "search and expand as you type" functionality of the tree.
Launch configuration sorting and grouping
Launch configurations and compounds now support a new structured attribute presentation. Using the order, group, and hidden attributes, you can sort, group, and hide configurations and compounds in the Debug configuration dropdown and in the Debug Quick Pick.
For example, a launch configuration in launch.json can have the following presentation field:
"presentation": {
    "group": "5_tests",
    "order": 10,
    "hidden": false
}
As an example, we've added presentations to some VS Code's own launch configurations in order to group them in a more meaningful way and to hide those configurations that are only a part of a compound launch config.

Debug Activity Bar icon and decoration
Based on user feedback, we've updated our Debug icon in the Activity Bar to better represent Run and Debug. And when debugging, there is a number decoration on the Debug icon to show the count of active debug sessions.

Tasks
User level tasks
Tasks declared in tasks.json are now supported at the User Settings level. If you have a build script that you use across many projects, or if you don't want your tasks in a project folder, you can add your tasks in the user tasks.json file. Run the Tasks: Open User Tasks command to create user level tasks and these tasks will be available across all folders and workspaces. Only the shell and process task types are supported here.
Input pickString label
If you use task inputs, you can add a friendly label to the pickString input options:
"inputs": [
  {
      "id": "pickAnInputValue",
      "description": "Pick a Value",
      "type": "pickString",
      "options": [
          "first-value",
          {
              "label": "Second Value",
              "value": "second-long-value-that-can-be-simplified-for-display"
          }
      ],
      "default": "first-value"
  }
]
The label will show as:

Languages
TypeScript 3.7.5
We've updated our bundled TypeScript version to 3.7.5. This minor update includes some important bugs fixes, including fixing IntelliSense for projects that are not stored on C: drives on Windows.
HTML Mirror Cursor off by default
The HTML Mirror Cursor is now an opt-in feature. In the upcoming iteration, we'll continue to improve its implementation to make this feature more easily understandable and available to more languages. You can still use this feature by turning on html.mirrorCursorOnMatchingTag.
Preview features
Preview features are not ready for release but are functional enough to use. We welcome your early feedback while they are under development.
Timeline view
In this milestone, we've made progress on the new Timeline view, and have an early preview to share. This is a unified view for visualizing time-series events (for example, Git commits, file saves, test runs, etc.) for a resource (file, folder). To enable the Timeline view, you must be using the Insiders edition and then add the following setting:
"timeline.showView": true
Below you can see the Timeline view displaying the Git commit history of a file:

Theme: Dark Amethyst
In this early preview, the Timeline view shows the Git commit history of the active document, which is currently limited to 32 items. Selecting one of those commits will open a diff view of the changes introduced by that commit. Extensions will also be able to contribute their own timeline sources, which will be shown in this unified timeline view. Eventually, you will also be able to select (filter), which sources you'd like to see in the view.
Stay tuned, we have much more in store for this new feature. You can follow along by subscribing to issue #84297 and by watching for issues tagged with the 'timeline' label. And if you have ideas on other types of information you'd like to see in this view, let us know!
Search Editor
We've continued work on our new Search editor, with the goal this iteration for the Search editor to be the primary search experience. To that end, we implemented a UI for configuring the Search editor's query:

Theme: Noctis Lilac, Font: Hasklig
There are now several commands for the Search editor, which you can bind to keyboard shortcuts of your choice:
search.action.openNewEditor: Open a new search editor in the active editor group.search.action.openInEditor: Copy the current Search results into a new Search editor.
For more information and further updates on the Search editor, see issue #23931.
Note: Search Editors are enabled by default in Insiders, and can be opted into in Stable by setting search.enableSearchEditorPreview to true.
Semantic highlighting for TypeScript & JavaScript
Semantic highlighting support for TypeScript and JavaScript is in development and not yet enabled by default. You can try it out by adding the following setting:
"editor.semanticHighlighting.enabled": true
When enabled, you will see that some identifiers have new colors and styles and are now highlighted according to their resolved type. The default syntax (TextMate) highlighter classifies many tokens as variables and these are now resolved into namespaces, classes, parameters, and so on.
You can see this best in the imports section, where now each imported symbol is colored with the symbol's type:

You can use the Developer: Inspect Editor Tokens and Scopes command to inspect the semantic and syntax tokens that are computed for each location.
New JavaScript debugger
We've been working on a new debugger for Node.js and Chrome. It's installed by default on Insiders, and can be installed from the Marketplace in VS Code Stable. You can start using it with your existing launch configurations by enabling the debug.javascript.usePreview setting. Below are some of the new features we added this month.
The new JS debugger will automatically debug commands you run in the new JavaScript Debug terminal, which you can open via the Debug: Create JavaScript Debug Terminal command:

Theme: Earthsong, Font: Fira Code
The new debugger also provides a Debug CodeLens in your package.json's scripts section that can run and debug scripts without extra configuration:

You can configure the visibility and location (top or inline) of the CodeLens via the debug.javascript.codelens.npmScripts setting.
Try it out! You can file issues in the vscode-js-debug repository, if you run into any problems with the new debugger.
Moving views from the Sidebar to the Panel
Work is actively being done to make it easier to customize the layout of VS Code. You can test out the progress with the setting:
"workbench.view.experimental.allowMovingToNewContainer": true
With the setting enabled, some views have a new context menu entry to move them between the Sidebar and Panel. Currently this setting only affects the Outline view in the Explorer and views contributed by extensions. You also cannot combine these views in the Panel like you can in the Sidebar.

Theme: LaserWave, Font: Cascadia Code
This is only a preview of the features and many aspects of it are likely to change including the limitations mentioned above. Feel free to check out further progress in our Insiders version.
Note about Search: With the new generalized method of moving views, the old Search view setting search.location and command Search: Toggle Search View Position (search.action.toggleSearchViewPosition) are being deprecated. Your setting should migrate automatically, but you will need to use the new generalized method to move the Search view going forward. You do not need to enable the experimental preview setting above in order to move the Search view with the new context menu entry.
TypeScript 3.8 beta support
Although VS Code will not bundle TypeScript 3.8 until its official release next month, this iteration we added support for all the exciting new TypeScript 3.8-beta features.
These include:
- IntelliSense and syntax highlighting of private fields in JavaScript and TypeScript files.
- Call Hierarchy support for JavaScript and TypeScript.
- The convert to template string refactoring!
You can easily try all these new TypeScript 3.8 features today by installing the TypeScript Nightly extension. Please share feedback and let us know if you run into any bugs with the TypeScript 3.8 beta!
Contributions to extensions
Java debugger supports Data Breakpoints
The Debugger for Java extension now supports Data Breakpoints, introduced in VS Code 1.38. This feature allows you to create breakpoints that will get hit when the value of a variable changes.
Below you can see the debugger breaks when the Owner.telephone string changes:

Java Call Hierarchy view
The Language Support for Java extension now supports a Call Hierarchy view, which shows all calls from or to a function and allows you to drill into callers of callers and call of calls.
Right-click on a symbol and select Peek > Peek Call Hierarchy to see the call hierarchy:

Remote Development
Work continues on the Remote Development extensions, which allow you to use a container, remote machine, or the Windows Subsystem for Linux (WSL) as a full-featured development environment.
Feature highlights in 1.42 include:
- Remote - SSH: Improved support for Windows servers, including automatic OS detection.
- WSL: Support for Reveal in Explorer to open the Windows Explorer for WSL resources.
- Dev Containers: Pre-built container images, which include dependencies such as Git and zsh.
- Forwarded Ports view: Map, view, and reuse SSH and container ports.
You can learn about new extension features and bug fixes in the Remote Development release notes.
Extension authoring
Codicons for reuse
For most VS Code icons, the codicon icon-font is used. Extensions can now reuse those icons in simple and declarative ways:
- The
vscode.ThemeIcontype can now be instantiated with the name of a codicon. For example,new vscode.ThemeIcon("zap"). - The
vscode.MarkdownStringtype now supports the$(<name>)inline syntax. For example,myMdString.appendMarkdown('Hello $(globe)');. Note that to use codicons withinMarkdownString, you must enable thesupportThemeIconsconstructor argument. commandsdefined in an extension'spackage.jsonfile can now use a codicon for their icon. Use the inline syntax, for example"icon": "$(zap)".

Theme: Light+
The hover example above is rendering every available codicon. The hover was created with the snippet below but for readability, most of the codicon names were removed from the all constant.
vscode.languages.registerHoverProvider(
  '*',
  new (class implements vscode.HoverProvider {
    provideHover(doc: vscode.TextDocument, pos: vscode.Position) {
      const all = `$(activate-breakpoints)$(add)...$(zoom-out)`;
      const md = new vscode.MarkdownString(all, true);
      return new vscode.Hover(md, doc.getWordRangeAtPosition(pos));
    }
  })()
);
Insert and replace for completion items
Completions that are triggered at the end of a word usually replace that word. However when completions are triggered inside words, it's not clear if the word-end should be replaced or not. Depending on the preference of the extension author, users get the one behavior or the other. That's not ideal and now there is an API to express the insert and replace ranges for a completion item.
For that, we have added a new OR-type to CompletionItem#range:
export class CompletionItem {
  range?: Range | { inserting: Range; replacing: Range };

  //...
}
- If the range is
undefined, then VS Code uses the current word range for replacing and the same range cropped at the cursor position for inserting. - If the range is a simple
vscode.Range, then VS Code knows there is only one location for inserting or replacing. - If the range is an object with
insertingandreplacingranges, VS Code will use them directly.
This information is used in combination with editor.suggest.insertMode setting that allows users to define their preference. We ask extension authors to please adopt this API quickly because we have plans to make insert and replace behavior more visible in the next release.
Refined CallHierarchyProvider
We made a small change to CallHierarchyProvider#prepareCallHierarchy so that it can now return one or many CallHierarchyItem elements. The many option is useful when asking for the call hierarchy on an element that has multiple overloads.
Creation options exposed on Terminals
The Terminal object has a new creationOptions property that can be used by extensions to identify how the terminal was created.
Language-specific settings
Extensions can now contribute settings that can be language overridable using the new configuration scope language-overridable.
Example:
"contributes": {
    "configuration": {
        "title": "sample",
        "properties": {
            "sample.languageSetting": {
                "type": "boolean",
                "scope": "language-overridable"
            }
        }
    }
}
The Configuration API is enhanced to support these settings. You can read and update these settings using the API by passing the necessary languageId.
Example:
/**
 * Read language configuration.
 */
const textDocumentConfiguration = vscode.workspace.getConfiguration('sample', {resource, languageId});
textDocumentConfiguration.get('languageSetting');

/**
 * Override configuration under language
 */
textDocumentConfiguration.update('languageSetting', false, ConfigurationTarget.Global, true);

/**
 * Listen language configuration changes
 */
workspace.onDidChangeConfiguration(e => {
    if(e.affectsConfiguration('sample.languageSetting',  {resource, languageId}) {
    }
});
For more information, see the Configuration API.
Extensions view context menu
You can now contribute commands to an extension's context menu in the Extensions view using the new menu location extension/context.
Example:
"contributes": {
    "commands": [
        {
            "command": "extension.helloWorld",
            "title": "Hello World"
        }
    ],
    "menus": {
        "extension/context": [
            {
                "command": "extension.helloWorld",
                "group": "2_configure",
                "when": "extensionStatus==installed",
            }
        ]
    }
}

The ID of the extension is passed as an argument when the command is run.
Example:
vscode.commands.registerCommand('extension.helloWorld', extensionId => {
  vscode.window.showInformationMessage(extensionId);
});
The following predefined contexts are supported, which you can use in when conditions for the command:
extensionStatus==installedisBuiltinExtension
DebugConfigurationProvider hook for accessing substituted variables
The extension API for debugging offers a hook resolveDebugConfiguration on the DebugConfigurationProvider that can be used to validate a debug configuration before it is passed to the debug adapter. Since this hook is called before variables are substituted, the validation code can easily add more variables to the debug configuration and still get them substituted in time.
This approach can make it difficult to use the resolved variable values in the resolveDebugConfiguration hook, for example to validate or implement functionality that solely exists in the extension (and not in the debug adapter where the substituted values are available). See issue #85206 for an example. Some extensions have started to substitute variables on their own (which is often incomplete since it does not cover all cases).
From an user's perspective, this is confusing. In debug configurations, some attributes variables can be used (because they are processed in the debug adapter after substitution has occurred) and some attributes variables cannot (because they are processed in the extension where substitution has not yet occurred). Issue #87450 is a good example of the latter problem.
In this milestone, we have addressed this problem by adding a second hook resolveDebugConfigurationWithSubstitutedVariables to the DebugConfigurationProvider that receives the debug configuration with all variables substituted.
With the availability of this new API, we are asking all debug extension authors to review their current implementations of DebugConfigurationProvider.resolveDebugConfiguration carefully and to move all code that does not introduce new variables but would profit from being run on the substituted variables into the new method resolveDebugConfigurationWithSubstitutedVariables.
Implement a debug adapter inside an extension
The existing debugging extension API supports registering a DebugAdapterDescriptorFactory for running a debug adapter several ways.
As an external process:
vscode.debug.registerDebugAdapterDescriptorFactory('mock', {
  createDebugAdapterDescriptor: _session => {
    return new vscode.DebugAdapterExecutable('mockDebug.exe');
  }
});
As a network session:
vscode.debug.registerDebugAdapterDescriptorFactory('mock', {
  createDebugAdapterDescriptor: _session => {
    return new vscode.DebugAdapterServer(12345, 'localhost');
  }
});
In this milestone, we've added a third variant where an 'inline' implementation of a debug adapter can be provided:
vscode.debug.registerDebugAdapterDescriptorFactory('mock', {
  createDebugAdapterDescriptor: _session => {
    return new vscode.DebugAdapterInlineImplementation(new InlineDebugAdapter());
  }
});
This eliminates the need for communicating with the adapter via a stream-based mechanism and simplifies development because the adapter runs inside the extension and can be easily debugged as part of VS Code's extension debugging.
The inline implementation (for example, the InlineDebugAdapter from above) needs to implement the Debug Adapter Protocol. Since we do not want to include the full Debug Adapter Protocol in VS Code's extension API, we have introduced a minimalistic subset of that protocol. The interface vscode.DebugAdapter has just two methods, one for passing a DAP message to the adapter (handleMessage), and one for listening for DAP messages received from the adapter (onDidSendMessage).
Based on this interface, an implementation of a debug adapter would start with this source code:
class InlineDebugAdapter implements vscode.DebugAdapter {
  private sendMessage = new vscode.EventEmitter<DebugProtocol.ProtocolMessage>();
  private sequence: 1;

  readonly onDidSendMessage: vscode.Event<DebugProtocol.ProtocolMessage> = this.sendMessage
    .event;

  handleMessage(message: DebugProtocol.ProtocolMessage): void {
    switch (message.type) {
      case 'request':
        const request = <DebugProtocol.Request>message;
        switch (request.command) {
          case 'initialize':
            const response: DebugProtocol.Response = {
              type: 'response',
              seq: this.sequence++,
              success: true,
              request_seq: request.seq,
              command: request.command
            };
            this.sendMessage.fire(response);
            break;
          // many more requests needs to be handled here...
          default:
            break;
        }
        break;
      case 'response':
        break;
      case 'event':
        break;
    }
  }

  dispose() {
    // clean up resources
  }
}
Since the debug adapter protocol (available as node module vscode-debugprotocol) is a compatible superset of the vscode.DebugAdapter interface, you can import the module if you need the full protocol and want to implement a debug adapter all by yourself.
A much simpler alternative is to (continue to) use our default implementation of a debug adapter, available as node module vscode-debugadapter. Starting with version 1.38.0-pre.4, the DebugSession (or LoggingDebugSession) introduced in this module is compatible with the interface vscode.DebugAdapter defined in the extension API.
With this API, an existing debug adapter implementation can be easily used like this:
vscode.debug.registerDebugAdapterDescriptorFactory('mock', {
  createDebugAdapterDescriptor: _session => {
    return new vscode.DebugAdapterInlineImplementation(new MockDebugSession());
  }
});
For details, see the Mock debug example.
Attention: In this release, we have completed the extension APIs for creating debug adapters. As such, we are announcing that we will remove support for two deprecated attributes of the debuggers contribution point in the March release:
adapterExecutableCommand- Use the extension APIsvscode.DebugAdapterDescriptorFactoryand avscode.DebugAdapterExecutableinstead. The Mock debug example shows how to use the API.enableBreakpointsFor- Use thebreakpointscontribution point instead. The conversion needs to be done inpackage.json.
If the current (deprecated) JSON looks like this:
"contributes": {
  "debuggers": [{
    "type": "csharp",
    // ...
    "enableBreakpointsFor": [ "csharp", "razor" ]
    // ...
  }]
The conversion would be:
"contributes": {
  "breakpoints": [
    { "language": "csharp" },
    { "language": "razor" }
  ],
  "debuggers": [{
    "type": "csharp",
    // ...
  }]
We suggest that affected extensions adapt their implementation to the new APIs in the February timeframe so that we have enough time to fix issues until March.
Proposed extension APIs
Every milestone comes with new proposed APIs and extension authors can try them out. As always, we are keen on your feedback. This is what you have to do to try out a proposed API:
- You must use Insiders because proposed APIs change frequently.
- You must have this line in the
package.jsonfile of your extension:"enableProposedApi": true. - Copy the latest version of the vscode.proposed.d.ts file into your project's source location.
Note that you cannot publish an extension that uses a proposed API. There may be breaking changes in the next release and we never want to break existing extensions.
Add workspace edit metadata
The Refactor Preview support that's now in VS Code comes with a new, optional API proposal. It allows you to classify changes of a workspace edit. For example, you can define whether changes need user confirmation or add a description such as "Renames in strings and comments". The proposal can be tracked in issue #77728 and its current design is around the WorkspaceEditMetadata interface.
Semantic highlighting
If you are interested in adding semantic highlighting to your language, the Semantic Highlighting Overview has a summary of the concepts and the new APIs.
Authentication providers
Some extensions require authenticating to other services. The proposal in issue #88309 would make it possible for extensions to register authentication providers that can be accessed by other extensions, providing a common mechanism for performing authentication.
Timeline providers
Extension will soon be able contribute their own sources into the new Timeline view. Interested in adding your own timeline source? Check out this early proposal in issue #84297 and provide any feedback you have.
Documentation.Refactoring contribution point
The proposed documentation.refactoring contribution point lets extensions provide documentation for their refactorings. Users can choose to view this documentation when they request refactorings:

The proposed contribution point gives extensions control over how their documentation is shown by using commands:
"contributes": {
  "documentation": {
    "refactoring": [
      {
        "title": "Learn more about JS/TS refactorings",
        "when": "typescript.isManagedFile",
        "command": "_typescript.learnMoreAboutRefactorings"
      }
    ]
  }
}
title— Label for the documentation action shown to users.when— When clause for when to display the documentation.command— Command that shows the documentation. For example, this command could open a webpage or show the documentation directly in VS Code.
Issue #86788 tracks the status of the proposal.
Backup and hot exit hooks for custom editors
We continued to iterate on the proposed custom editor API this iteration. Our major investigation this month was how to enable hot exit for custom editors. Issue #88719 covers some of the challenges we ran into to support hot exit and some of the approaches we considered.
The outcome of this investigation is a new optional backup method on the WebviewCustomEditorEditingDelegate interface. This method is invoked by VS Code a second or so after the resource is changed. Inside the backup method, extensions should persist the resource in its current state. Most often, this means writing the resource to the workspace storage folder. Then, when the editor is reloaded, it should check to see if any persisted backups exist before loading the resource from the workspace itself.
We will continue iterating on the custom editor API next iteration.
Complex completion label
We are evolving the CompletionItem API to accommodate complex completion items that need to provide qualified name, import path, return type, and other information. The information must be provided upfront, not resolved later. Provided information will be shown inline in the suggest widget. We'll iterate on the current proposal in the next iteration. Meanwhile, we are considering adding a Status Bar to the suggest widget to solve some of the UI and discoverability challenges. We look forward to your feedback on the API.
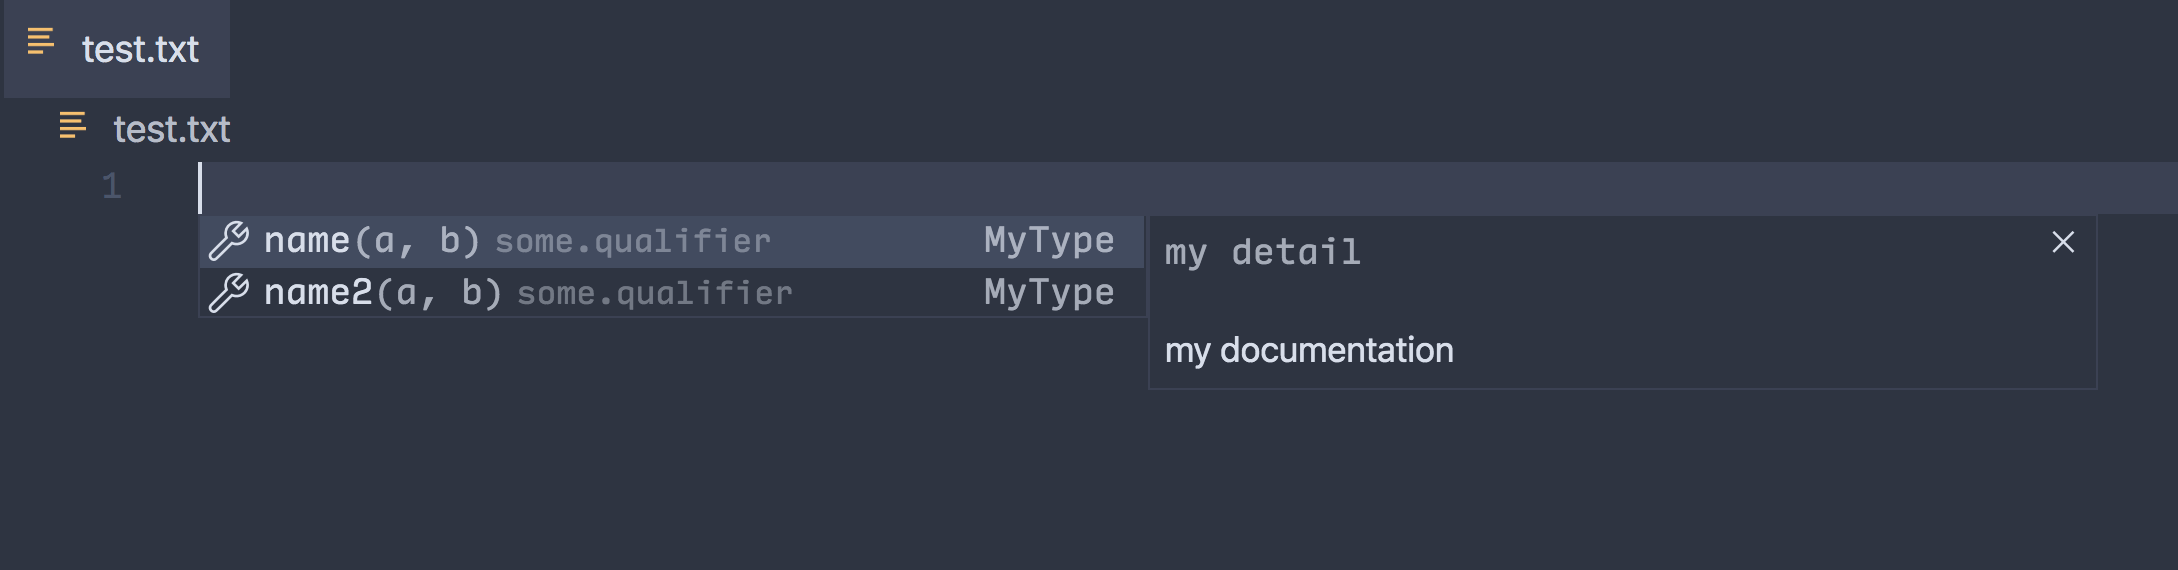
Theme: Nord, Font: Input Mono
Adding links to diagnostic errors
Diagnostic errors can now have a link associated with its error code. When a link is provided, it will be shown in the Problems panel, inline error view, and diagnostic error hover. As we continue to work on this feature in the next iteration, you can provide feedback in issue #11847.

Language Server Protocol
The 3.15 version of the Language Server Protocol is now available. We also released the corresponding npm modules for the VS Code LSP client and for LSP servers written in Node.js. The latest version of the libraries contains a proposed specification and implementation for semantic tokens.
The LSP Web site now hosts a preliminary version of the Language Server Index Format specification as well as a corresponding LSIF overview.
Browser support
Drag and drop files into the editor
When using VS Code in a browser, you can now drop local files into the editor area to open them as dirty (unsaved) files with the contents of the files.

New Commands
| Key | Command | Command ID |
|---|---|---|
| Move Panel Left | workbench.action.positionPanelLeft |
|
| Move Panel Right | workbench.action.positionPanelRight |
|
| Move Panel To Bottom | workbench.action.positionPanelBottom |
|
| Open Next Recently Used Editor | workbench.action.openNextRecentlyUsedEditor |
|
| Open Previously Used Editor | workbench.action.openPreviousRecentlyUsedEditor |
|
| Open Next Recently Used Editor in Group | workbench.action.openNextRecentlyUsedEditorInGroup |
|
| Open Previously Used Editor in Group | workbench.action.openPreviousRecentlyUsedEditorInGroup |
|
| Open Picker of Most Recently Used Editors | workbench.action.showAllEditorsByMostRecentlyUsed |
|
| Open Previously Used Editor via Picker | workbench.action.quickOpenPreviousRecentlyUsedEditor |
|
| ⌃Tab (Windows, Linux Ctrl+Tab) | Open Previously Used Editor in Group via Picker | workbench.action.quickOpenPreviousRecentlyUsedEditorInGroup |
| Open Least Used Editor via Picker | workbench.action.quickOpenLeastRecentlyUsedEditor |
|
| ⌃⇧Tab (Windows, Linux Ctrl+Shift+Tab) | Open Least Used Editor in Group via Picker | workbench.action.quickOpenLeastRecentlyUsedEditorInGroup |
| Developer: Restart Extension Host | workbench.action.restartExtensionHost |
Engineering
TSLint to ESLint migration
VS Code is mostly written in TypeScript. In addition to the compiler, we use linting to enforce certain style and engineering rules. In the past, we have used TSLint for that task, but roughly a year ago, the maintainers of TSLint announced its deprecation in favor of ESLint.
This milestone we have migrated to ESLint - that includes our lint-configuration and our custom rules. Last but not least, we have also updated the yo code extension generator so that new TypeScript extensions are also checked by ESLint.
If you are using TSLint in your own projects, we've created a Migrate TSLint to ESLint guide to help you to switch to ESLint.
Building VS Code with TypeScript 3.8-beta
VS Code is now built using the TypeScript 3.8 beta release.
Support for hosting the Monaco Editor in Shadow DOM
We have fixed various issues around mouse handling and dynamic CSS so that the Monaco Editor can now be hosted inside a Shadow DOM API shadow root.
New documentation
Containers
There are new articles covering creating containers with the Microsoft Docker extension. You'll find tutorials for containerizing Node.js and ASP.NET Core applications, pushing to a container registry, and deploying containers to the cloud.

Notable fixes
- 12058: Save UI state periodically to prevent loss on shutdown
- 79205: Explorer tree does not show correct content when connected to case sensitive file system on a case insensitive platform
- 83543: Debug program location only shown for active session
- 85057: Move dialog details to description row in custom dialog
- 86445: Unable to delete multiple Watch debug variables simultaneously via hotkey
- 88240: Slow to create many Watch dropdown expressions
- 89057: Let read-only editors show problems
- 89405: Text files: do not report dirty for readonly models
Thank you
Last but certainly not least, a big Thank You! to the following folks that helped to make VS Code even better:
Contributions to our issue tracking:
Contributions to vscode:
- Alexander Fell (@AlexFell-Velo): add position panel left PR #84477
- AlexStrNik (@AlexStrNik): Fix #89493 PR #89653
- Brett Cannon (@brettcannon): Merge pull request #87946 from brettcannon/patch-2 PR #87946
- Bura Chuhadar (@BuraChuhadar)
- Siberian Cat (@cat-kitten): Roblox XML file syntax highlight support PR #87755
- Charles Gagnon (@Charles-Gagnon): Don't instrument any test code for coverage PR #86608
- Chayim Refael Friedman (@ChayimFriedman2): Hide Debug Console After Session Has Stopped PR #83249
- Daniel Beigi (@dbeigi): Fixed #83983 added highlight collapsed PR #84955
- Dmitry Gozman (@dgozman): Process debug adapter messages in separate tasks; see #33822, #79196 PR #81403
- Dima Krasner (@dimkr): Bump node-native-keymap to 2.1.1 for easier arm64 cross-compilation PR #86659
- David Lechner (@dlech): Fix threads not fetched after restarting debug adapter PR #88790
- Daryl Chan (@dvrylc): Hide Markdown preview editor icon when there is no active icon theme PR #88692
- Fabien Launay (@FabienLaunay)
- Gabriel DeBacker (@GabeDeBacker): Allows extension install and uninstall command execution to throw exceptions back to caller PR #88714
- Jens Fischer (@Gama11): Clarify the docs for QuickPickItem.description and detail PR #88622
- John Murray (@gjsjohnmurray): #85645 display Variables fetch failure message PR #85842
- @GustavoASC
- Yunseok (@hannut91): Fix typo PR #88824
- Harald Rosberg (@hrosb): bump electron to 6.1.6, fixes missing window titles in accessibility apps PR #86837
- Andrew Liu (@hypercubestart): fix parsed JSDoc author tag PR #80898
- Yuki Ueda (@Ikuyadeu): Replace 'declare var' with 'declare const' PR #87709
- Andrii Dieiev (@IllusionMH): Debounce on type history entries for "files to include/exclude" fields PR #86785
- Jason (@JasonMFry): :speech_balloon: Fix grammar on Welcome Page PR #88801
- Jean Pierre (@jeanp413)
- Merge pull request #87827 from jeanp413/fix-79857 PR #87827
- Fixes links in enum setting values can't be clicked PR #86463
- Fixes cannot create new debug watch expressions while filtering is active PR #88502
- Fixes file drag and drop does not open the explorer pane PR #88078
- Fixes incorrect focused element when creating new file/folder and renaming in file explorer PR #87052
- Fixes snippet replace when before prefix PR #86509
- Fixes terminal env variables don't resolve in empty workspaces PR #83369
- Fix mightProducePrintableCharacter numeric keypad support PR #77911
- Add setting to control whether to focus the inline editor in peek widget by default PR #88185
- Andy Edwards (@jedwards1211): fix(extHostProgress): throttle instead of debounce PR #86161
- Jon Bockhorst (@jmbockhorst): Make terminal link behavior consistent with the editor PR #83620
- Robert Jin (@jzyrobert)
- Refactor SortOrder & SortOrderConfiguration into one enum PR #87114
- Add CompletionItem conversion for additionalTextEdits PR #87648
- #85858 Allow breadcrumbs.symbolSortOrder per language PR #86430
- #88125 Reverse action order in goToErrorWidget PR #88167
- Correct LocationLink link syntax PR #87613
- #82352 Implement sorting for search results PR #86563
- Kristian Thy (@kthy): feat: region folding for perl5 PR #85642
- kevinn (@latel): fix minimal wrong spell in stateService PR #86744
- Jiaxun Wei (@LeuisKen): fix: add 'allow-forms' to sandbox attribute. PR #87334
- Luis Oliveira (@lmvco): Support for Shadow DOM PR #88536
- Jonathan Carter (@lostintangent): Remove scheme restriction for Markdown/Emmet language features PR #87541
- Maher Jendoubi (@MaherJendoubi): Contributing: fix typos PR #89256
- Maira Wenzel (@mairaw): fix typo PR #88730
- Matias Godoy (@mattogodoy): Fix typo PR #86957
- Matt Crouch (@mjcrouch): Fix missing styling from various icon container locations PR #88157
- Marko Novakovic (@mnovakovic): CallStackView attempts to move the active frame to the top PR #88074
- Mohammad Rahhal (@mrahhal): Fix mirror cursor selection PR #86986
- Ilya Murav'jov (@muravjov): editor.insertSpaceAfterComment setting PR #41747
- Micah Smith (@Olovan): Fix #84145 when toggling terminal pane PR #88098
- pan93412 (@pan93412): fix(tokenClassificationExtensionPoint): some typos PR #89704
- Przemek Dziewa (@pdziewa): Fix long statusbar items PR #87164
- Oliver Larsson (@Playturbo): Friendly pickstring options PR #89180
- Remy Suen (@rcjsuen): Add missing documentation to CompletionItem's insertText PR #87115
- @romainHainaut: Fix #83644 PR #86619
- Sameer Puri (@sameer): Enable Shift-Insert to paste primary clipboard on Linux, fixes #36170. PR #63374
- @sharkykh: Restore "current git branch name when renaming" PR #86919
- Simon Siefke (@SimonSiefke): fix #87181: typescript completion item kind for local function PR #87182
- @smilegodly: got rid of duplicate "Clear Search" and "No Settings Found" PR #86494
- Konstantin Solomatov (@solomatov)
- @SPGoding: Fix wrong key in the extension package.json schema PR #87042
- @sportshead: Removed search.location from search.contribution.ts PR #89585
- @sverg1: customEditor toggle and save/preview keybinds PR #86505
- Ye Zhihao (@Vigilans): Fix list service of TreeView mishandled in block for FileExplorer PR #87805
- @xearonet: Fix .bat variable surround PR #88986
- Pen Tree (@zyctree): Fix a typo in vscode.d.ts PR #87704
Contributions to vscode-eslint:
- Nikhil Verma (@NikhilVerma): Make it clear that modes are arrays and not objects for config PR #853
- Tyler Waters (@tswaters): Fixes #805: Support eslint in package.json PR #877
Contributions to language-server-protocol:
- Sebastian Zarnekow (@szarnekow): Fixed minor formatting glitch PR #876
- @KamasamaK
Contributions to vscode-languageserver-node:
Contributions to debug-adapter-protocol:
- Gerald Richter (@richterger): Update adapters.md PR #89
Contributions to vscode-vsce:
- Felix Hao (@felixhao28): Support linked npm modules PR #411
- 道化師 (@wraith13): Modifying messages to match the current situation PR #409
- Shaun Tabone (@xontab): Log level for npm list command changed to error to increase compatibility PR #412
Contributions to vscode-js-debug
- Ben Creasy (@jcrben): fix: allow omitting "program" from launch.json PR #203
Contributions to vscode-generator-code:
- Jake Witcher (@jakewitcher): fix typo in language-configuration.json of language extension template PR #189
- Stavros Tsourlidakis (@stsourlidakis): fix eslint problems in ext-command-js/test PR #190
Contributions to vscode-azurecli:
- Matthew Burleigh (@mburleigh): Support multiline commands PR #61
Contributions to vscode-emmet-helper:
- Diogo Felix (@onlurking): feat: update emmet abbreviations PR #34
Contributions to localization:
There are over 800 Cloud + AI Localization community members using the Microsoft Localization Community Platform (MLCP), with over about 170 active contributors to Visual Studio Code. We appreciate your contributions, either by providing new translations, voting on translations, or suggesting process improvements.
Here is a snapshot of contributors. For details about the project including the contributor name list, visit the project site at https://aka.ms/vscodeloc.
- Bosnian (Latin, Bosnia and Herzegovina): Sead Mulahasanović, Adnan Rizvan, Ismar Bašanović.
- Bulgarian: Andreyka Lechev.
- Czech: Michal Černík.
- Danish: Lasse Stilvang.
- Dutch: Philip Denys, Lemuel Gomez, Dennis Hummel, Gideon van de Laar.
- English (United Kingdom): Martin Littlecott, Alexander Ogilvie, Krishna Regar, Alonso Calderon, Daniel Imms, Kamalsinh Solanki.
- Finnish: Tuula P.
- French: Antoine Griffard, Thierry DEMAN-BARCELÒ, Edouard Choinière, Joel Monniot, Rodolphe NOEL, Lucas A., Alain, BUFERNE, Xavier Laffargue, Mohamed Sahbi, DJ Dakta.
- German: Pascal Wiesendanger, Marvin Heilemann, jan-nitsche, Jakob von der Haar, Michael Richter.
- Greek: Valantis Kamayiannis, Θοδωρής Τσιρπάνης.
- Hebrew: Ariel Bachar.
- Hindi: Kiren Paul, Niraj Kumar, Preeti Madhwal, Jaadu Jinn, Mahtab Alam.
- Hungarian: József Cserkó, Kiss Attila Csaba, Krisztián Papp.
- Chinese Simplified: Yizhi Gu, Tingting Yi, Justin Liu, ick, Charles Dong, Peng Zeng, Tony Xia, 斌 项, 普鲁文, paul cheung, 张锐, Zhiqiang Li, Yixing Zheng, AlexiZz Nakido, 冉 耀隆, Chow David, Sheng Jiang, yungkei fan, Yao Rui, Joel Yang, 钟越, Chenglong Wei, 一斤瓜子, Yiting Zhu, Alexander ZHANG, YanJun Sun, Libing Yang, ZHENGCHENG CHEN, 张 任飞, 光宇 朴, 石岩 詹, 舜杰 杨, WJ Wang, Siam Chen.
- Chinese Traditional: Winnie Lin, 船長, Alan Tsai, TingWen Su.
- Indonesian: Eriawan Kusumawardhono, Aldila, Arif Fahmi, Laurensius Dede Suhardiman, Mychael Go, Christian Elbrianno, Septian Adi.
- Italian: Alessandro Alpi, Luigi Bruno.
- Japanese: Takayuki Fuwa, Seiichi Ariga, Koichi Makino, Yoshihisa Ozaki, 貴康 内田, Ishii Shun, Kyohei Uchida, TENMYO Masakazu, Aya Tokura.
- Korean: Hongju.
- Latvian: Andris Vilde.
- Norwegian: Frode Aarebrot, Anders Stensaas, Thomas Ødegård, Thomas Isaksen.
- Polish: Makabeus Orban, Mateusz Redynk, Kacper Łakomski, Piotr Rysak, Wojciech Maj, Oskar Janczak, Szymon Seliga, Franx Bar, Marcin Anonimus.
- Portuguese (Brazil): Marcelo Fernandes, Arthur Lima, Albert Tanure, Loiane Groner, Nylsinho Santos, Alessandro Trovato, Pudda, Matheus Vitti Santos, Rodrigo Crespi, Wellington OStemberg, Roberto Fonseca, Felipe Galante, Rodrigo Tavares, Alessandro Fragnani, Felipe Nascimento, Alexis Lopes.
- Portuguese(Portugal): Francisco Osorio, Luís Chaves, Ricardo Sousa Vieira, João Fernandes.
- Romanian: Tiberiu Frățilă, LaServici, Dan Ichim.
- Russian: Vadim Svitkin, Николай Соколовский, Дмитрий Кирьянов, Baturin Valery.
- Serbian Cyrillic: Dusan Milojkovic.
- Spanish: José María Aguilar, Ricardo Estrada Rdez, JOSE AHIAS LOPEZ PORTILLO, Gustavo Gabriel Gonzalez, Camilo Sasía.
- Swedish: Pelle Alstermo.
- Tamil: Rajesh Waran, MUTHU VIJAY, Sankar Raj, Kadhireshan S, saravanan ramesh, Aravindh JANAKIRAMAN, Pandidurai R, Madhu Chakravarthy, Madhu Maha.
- Turkish: Mehmet Yönügül, Özgür ERSOY, mehmetcan Gün, Misir Jafarov, Isa Inalcik, Fırat Eşki, Gökberk Nur, Safa Selim.
- Ukrainian: Serhii Shulhin, Arthur Murauskas, Oleksandr Krasnokutskyi, Фомін Тарас.
- Vietnamese: Dat Nguyen, Vương, Van-Tien Hoang, Dao Ngo, ng-hai.