February 2016 (0.10.11)
February is our last full iteration before we start the end game for the Build 2016 conference milestone at the end of March. It comes with many improvements:
- Salsa is now the default JavaScript language service.
- Folding, the most requested feature, is now available.
- There is support for localization and accessibility.
In addition, we continued to listen to your issues and feature requests.
Downloads: Windows | OS X | Linux 32-bit | Linux 64-bit
Languages - JavaScript
The Salsa JavaScript language service was available as preview in January and it is now the default language service for JavaScript in the February update.
Improvements
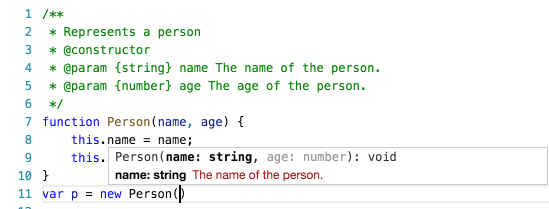
The JSDoc comment format is now understood and used to improve IntelliSense proposals and parameter hints:
You now get IntelliSense proposals for properties in 'ECMAScript 3 style classes':
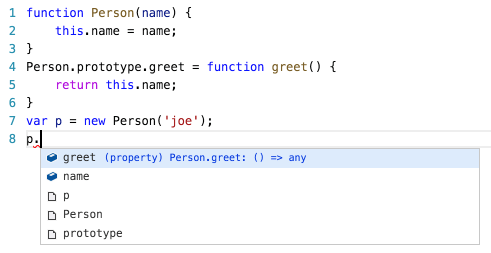
IntelliSense offers both inferred proposals and the global identifiers of the project. The inferred symbols are presented first, followed by the global identifiers (with the document icon), as you can see in the image above.
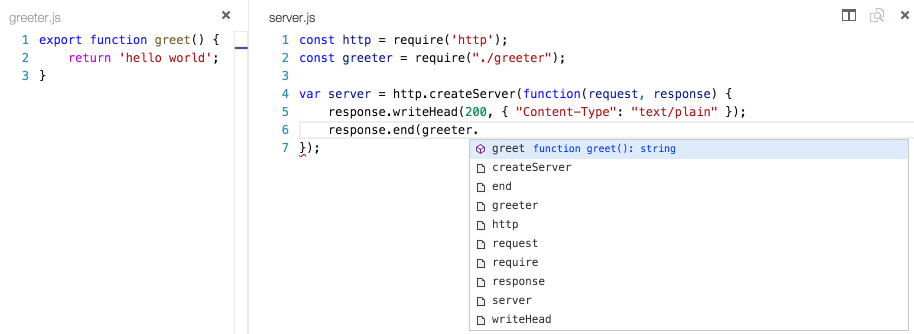
The CommonJS module support has been improved as well:
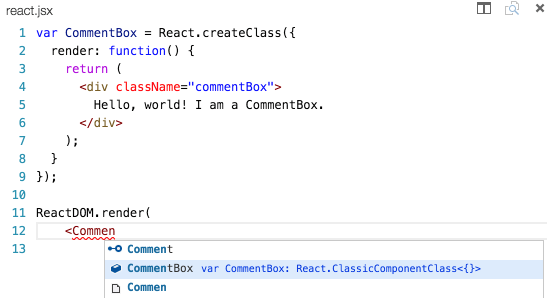
There is now support for JSX/React:
Tip: To get IntelliSense for React/JSX, install the typings for
react-globalby runningtsd install react-globalortypings install dt~react --globalfrom the terminal.
Tip: When you use eslint for linting (see below) and you used
eslint --initto create an eslint configuration and you answeredyesto "Do you use React?", then the settingexperimentalObjectRestSpreadis enabled. Support for ObjectRestSpread is not yet provided by Salsa but it is on the roadmap (see #2103).
There is now support for React Native:
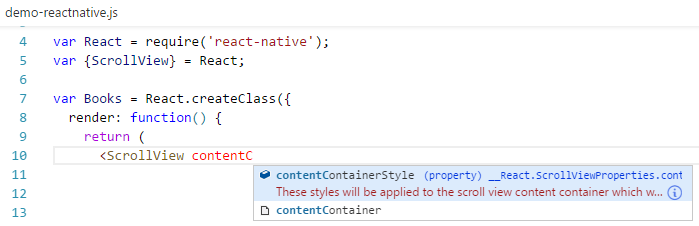
Tip: To get IntelliSense for React Native, install the typings for
react-nativeby runningtsd install react-nativeortypings install dt~react-native --globalfrom the terminal. Or even better... if you also want debugging support then install the preview of the React Native extension.
Tip: There is a known issue in that Salsa Doesn't Provide IntelliSense When Using Import Statements.
It is now possible to have mixed TypeScript and JavaScript projects. To enable JavaScript inside a TypeScript project, you can set the allowJs property to true in the tsconfig.json.
Tip: The
tsccompiler does not detect the presence of ajsconfig.jsonfile automatically. Use the–pargument to maketscuse yourjsconfig.jsonfile, e.g.tsc -p jsconfig.json.
Finally, the TypeScript compiler tsc can down-level compile JavaScript files from ES6 to another language level.
Migration Notes
The following sections describe a few of VS Code's features that have changed with the move to Salsa and provide information about maintaining previous behaviors.
Linters
Previously the JavaScript language support provided some linting options enabled by the javascript.validate.lint.* settings. With jshint and eslint, there are powerful linters for JavaScript available. Also, there are now extensions for VS Code available that integrate these linters. Therefore, we have decided to deprecate the built-in linter and Salsa now reports syntax errors only. We strongly recommend that you install and configure a JavaScript linter if your project hasn't done so already.
In particular, the previous JavaScript infrastructure provided an implicit lint rule which warned about undeclared variables unless they are mentioned in a /*global*/ comment block. This rule is no longer active and needs to be configured in your linter of choice.
Here are the steps to set up eslint:
npm install eslintto installeslintinto your workspace ornpm install -g eslintto install it globally.- install the VS Code eslint extension.
- use
eslint --initto create an initial eslint configuration by answering questions or by picking a popular configuration.
Tip: If you use JSON as the format of the eslint configuration file, then VS Code can provide you with IntelliSense when you edit the .eslintrc.json file.
This .eslintrc.json corresponds roughly to the lint settings of the old JavaScript infrastructure.
Changes in jsconfig.json
exclude lists
The previous JavaScript language service had a built-in list for folders that should be excluded from the project context. This list included the folders: node_modules, bower_components, jspm_packages, tmp, and temp. This implicit behavior has changed in favor of an explicit list defined by the user. Therefore if you use...
nodeexclude thenode_modulesfolderbowerexclude thebower_componentsfolderemberexclude thetmpandtempfolderjspmexclude thejspm_packagesfolderwebpackthen exclude the output folder, e.g.,dist.
Tip: After editing the jsconfig.json, do not forget to run the Reload JavaScript command to ensure that everything is up to date.
Defaults
If you do not have a jsconfig.json in your workspace then the following defaults are used:
- the
excludelist includes thenode_modulesfolder and the folder defined by theoutattribute.
Be aware that if you have no jsconfig.json defined to mark the root of your project, then each JavaScript file is considered an island by Salsa. Without a jsconfig.json file, cross-file and Typings file IntelliSense will not work.
js-is-jsx extension deprecation
The js-is-jsx extension is no longer needed since Salsa gives you coloring for JSX constructs inside .js files out of the box. We recommend you uninstall this extension.
No longer supported
Salsa undoubtedly provides a much better experience writing JavaScript applications in VS Code. By moving to Salsa, we give up a few features previously available with our old JavaScript language service:
- The source language level is now always ECMAScript 6. Previously, there was support to define a lower level using the
targetattribute insidejsconfig.json. This support has been removed and thetargetattribute is now only used bytscto define the target version when a JavaScript file is compiled to a lower ECMAScript version. - The previous JavaScript infrastructure attempted to resolve references for
AMDmodules. This hasn't worked in all cases and support forAMDto resolve references across files is currently no longer supported. - There is no longer support for IntelliSense in
scriptsections inside HTML documents. - The
javascript.validate.*settings are no longer supported and are ignored (see above). - The previous JavaScript infrastructure provided quick fixes to add an undefined variable as a global and to fetch a type definition from definitely typed. These quick fixes are no longer available.
- A file without a .js suffix that VS Code identifies as a JavaScript file is now treated as a .ts file and you get unexpected type errors (#issue 7291).
Languages - TypeScript
VS Code now ships with the latest TypeScript 1.8.2 version.
Migration Notes
Note: With the move to TypeScript 1.8.2, you will need to have a
jsconfig.jsonin your workspace for TypeScript definition files (for examplenode.d.ts) to be picked up.
If you don't already have a jsconfig.json file in your workspace, add a jsconfig.json file to the root with the compilerOptions:module attribute set:
{
  "compilerOptions": {
    "module": "CommonJS"
  }
}
Languages - C#
C# language support is now an optional install from the Marketplace. You can install it from within VS Code by searching for 'C#':
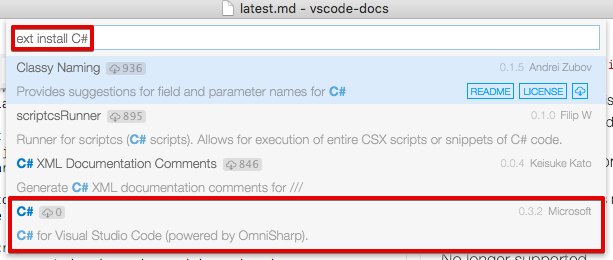
or if you already have a project with C# files, VS Code will prompt you to install the extension as soon as you open a C# file.
Editor
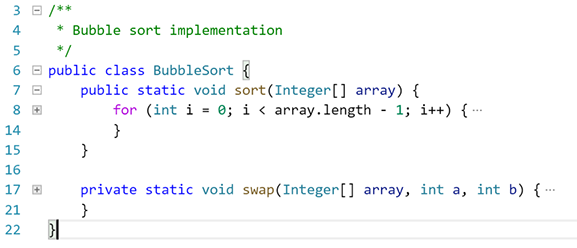
Source Code Folding
The editor now contains a first implementation of code folding. You can turn the feature on and off with the editor.folding configuration setting (File > Preferences > Settings). Once enabled, you can collapse and expand code regions using the folding icons next to the line numbers. Regions that can be folded are shown with a - icon, regions that are already folded with the + icon. The - icon only shows when the mouse is over the gutter.
Additionally you can use the following commands from the commands menu (F1) or with keyboard shortcuts:
- Fold (⌥⌘[ (Windows, Linux Alt+cmd+[)) folds the innermost uncollapsed region at the cursor
- Unfold (⌥⌘] (Windows, Linux Alt+cmd+])) unfolds the collapsed region at the cursor
- Fold All (⌘K ⌘0 (Windows, Linux cmd+K cmd+0)) folds all region in the editor
- Unfold All (⌘K ⌘J (Windows, Linux cmd+K cmd+J)) unfolds all regions in the editor
The folding regions are evaluated solely based on the indentation of each line. This first version does not yet support language agnostic folding regions, or folding markers. This is in discussion for an upcoming release (see issue #3422).
IntelliSense Performance
The IntelliSense widget underwent a full rewrite to address some performance problems. It now handles lists of 20,000 extensions in milliseconds, compared to the previous ~10 seconds of lag.
Indentation
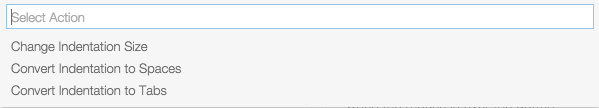
Initiated by user request #1228, we have added indentation status in the editor to help with 'tabs to spaces' conversion and vice versa. The Status Bar shows whether the Tab key will insert spaces or tabs and the current indentation size in characters.
![]()
You can adjust the indentation size and toggle between tabs and spaces with three new actions:
Ruler Settings
There is a new setting editor.rulers available. For example, setting it to [80, 120] will display two vertical rulers in the editor, one after the 80th character and one after the 120th character.
Default End of Line Sequence
A new setting files.eol controls the default new line character when creating new files. It defaults to \r\n on Windows and to \n on Linux and OS X.
Word navigation and word separators
Word navigation and word deletion commands updated and now honor a new setting, editor.wordSeparators, when deciding what is a word, regardless of the current language of the file.
Improved usage of web workers
With the adoption of the Salsa JavaScript language service as the default, we could streamline our usage of web workers and now have a dedicated web worker that is language agnostic, which we use for diff computation, link detection or simple textual completions. This reduces the latency of these computations and is memory friendly, as it automatically shuts down when not needed.
Workbench
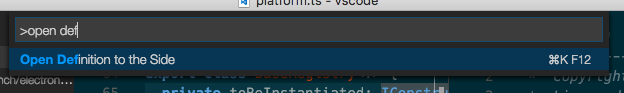
Open Definition to the Side
There is now an action to open a definition to the side in the Command Palette (⌘K F12 (Windows, Linux cmd+K F12)).
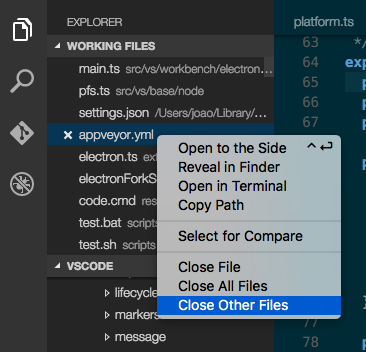
Close Other Files
There is now an action to close all other files, in the Working Files' context menu ().
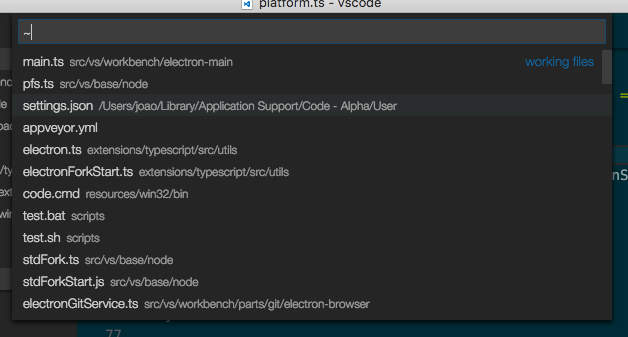
Switch to a working file from Quick Open
It's now possible to open a file in the Working Files list from the Quick Open box by prefixing it with ~.
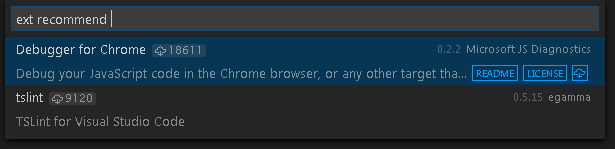
Extension Recommendations
There is a new command Extensions: Show Extension Recommendations for displaying suggested extensions based on your use of VS Code. You can reach this by typing ext recommend (trailing space) in the Quick Open box.
Extension Marketplace Performance Improvement
The performance of the in-product Extension Marketplace (via the Extensions: Install Extension command) has been greatly improved. We introduced a server-side cache which speeds up the request considerably.
Debugging
VS Code no longer 'fixes' Relative Paths in Launch Configurations
In the January milestone, we deprecated the use of relative paths in launch configurations (but still continued to convert relative in absolute paths). With this milestone, we've dropped this automatic fixing in favor of a more transparent strategy: VS Code no longer modifies launch configuration paths when sending them to the debug adapter. This is now the same treatment of paths as for task configurations.
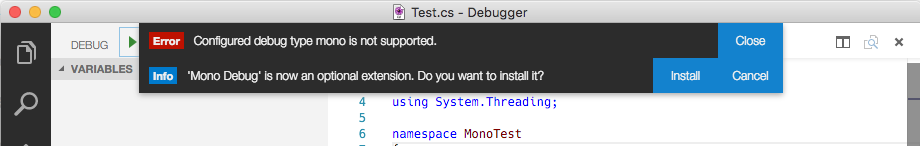
If you haven't already fixed your launch configuration paths for the January release, then you will now see this (or similar) errors when starting a debug session:

Just prefixing the relative path with a ${workspaceRoot}/ should fix the problem.
Pre Launch Task Improvements
We have improved the preLaunchTask based on user feedback and feature requests:
-
If
preLaunchTaskproduces an error, debugging does not start and a message with an option to continue debugging despite the error is shown.
-
If a
preLaunchTaskis a watching task, debugging does not start before the watching task becomes inactive. -
If a
tasks.jsonis missing and apreLaunchTaskis set, we offer to create atasks.jsonfor the user.
Support for Node.js 'nodemon' Development Setup
The VS Code Node.js debugger now supports an automatic restart mode for the 'attach' launch configuration.
This feature is useful if you use nodemon to restart Node.js on file changes.
Setting the launch configuration attribute restart to true makes node-debug automatically try to re-attach to Node.js after a debug session has ended.
On the command line, start your Node.js program server.js:
nodemon --debug server.js
In VS Code, create an 'attach' launch configuration:
{
  "name": "Attach",
  "type": "node",
  "request": "attach",
  "port": 5858,
  "restart": true
}
Tip: Pressing the Stop button stops the debug session and disconnects from Node.js, but nodemon (and Node.js) will continue to run. So to stop nodemon you will have to kill it from the command line.
Tip: In case of syntax errors, nodemon will not be able to start Node.js successfully until the error has been fixed. In this case VS Code will continue trying to attach to Node.js but eventually give up (after 10 seconds). To avoid this you can increase the timeout by adding a
timeoutattribute with a larger value (in milliseconds).
Function Breakpoints
Instead of placing breakpoints directly in the code, the VS Code Node.js debugger now supports creating breakpoints by specifying a function name. This is useful in situations where source is not available but a function name is known.
A 'function breakpoint' is created by pressing the '+' button in the Breakpoints view header:
Please note: Node.js support for function breakpoints is limited because:
- function breakpoints only work for global, non-native functions and
- function breakpoints can only be created if the function has been defined (seen by Node.js).
Mono Debugging is now an Optional Install
Since C# support in VS Code has been turned into an optional install, we have done the same with the Mono debugger. The Mono debugger has now become 'Mono Debug' on the Visual Studio Marketplace.
You can either install the Mono Debug extension with the VS Code Extensions: Install Extension command or if you already have a Mono based project with a mono launch configuration, simply by starting a debug session. VS Code will then suggest to download and install Mono Debug automatically:
Tasks
The eslint-stylish problem matcher changed to use absolute file paths by default. We made this breaking change because the stylish reporter integrated into eslint reports absolute paths by default. If you are using an older version of eslint with the external stylish reporter that reports relative file paths, you can tweak the problemMatcher in a tasks.json file as below to make this combination work:
"problemMatcher": {
    "base": "$eslint-stylish",
    "fileLocation": "relative"
}
Setup
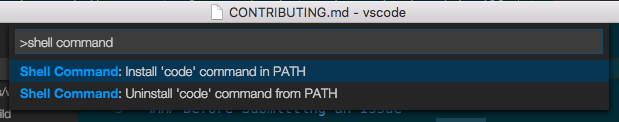
OS X Shell Command
In OS X, two new commands were added to install the VS Code shell command in the $PATH environment variable list. This makes the previous alias in ~/.bash_profile deprecated and we recommend you to remove it and use this command instead.
Telemetry Opt Out
Users now can opt out of usage telemetry via the telemetry.enableTelemetry setting.
Improved Command Line Interaction
The command line interface for code has been unified across all platforms and now supports a few arguments such as --help and --version.
Accessibility
Accessibility has been a constant theme over the past milestones and in February VS Code has been improved across the feature space.
High Contrast Theme
As a part of the accessibility work, the High Contrast theme, which was only available for Windows users, is now enabled for all 3 platforms.
Screen reading
We have turned on by default a new strategy for screen readers in the editor, one that is based on paging the text. From our testing, this is the best option in terms of trade-off between good screen reader support and performance when dealing with very large files.
The Go to Next/Previous Error or Warning actions (F8 and ⇧F8 (Windows, Linux Shift+F8)) now allow screen readers to announce the error or warning messages.
Improved Debugger Accessibility
Based on user feedback, we have improved debugger accessibility:
- Changes in debug state are read out (e.g. 'started', 'breakpoint hit', 'terminated', ...)
- All debug actions are keyboard accessible
- Focus intuitively moves inside the Debug View and Debug Console
- Debug hover is keyboard accessible (⌘K ⌘I (Windows, Linux cmd+K cmd+I))
Localization
Support has been added to localize package.json files for extensions and CommonJS code. For localizing CommonJS code, we've published a new npm module vscode-nls which helps you with localizing strings in your VS Code extension.
Extension Authoring
Always install a compatible version of the extension if possible
VS Code will now fallback to installing the latest compatible version of an extension with its own version, in case the latest extension version isn't compatible. This prevents users from installing extensions that could fail to activate.
Debug Adapter
We now support more OS types for the debuggers contribution point (see #1696 for details). In addition to win, linux, and osx, adapters can now use winx86 in their package.json to specify options specific to a 32-bit Windows:
"debuggers": [{
    "type": "gdb",
    "win": {
        "program": "./bin/gdbDebug.exe"
    },
    "winx86": {
        "program": "./bin/gdbDebug_x86.exe"
    }
}]
Debug Protocol Changes
We have changed the debug protocol in the following (backward compatible) ways:
-
Feature negotiation:
-
A boolean
supportsConditionalBreakpointsinCapabilitiesindicates whether the debug adapter supports conditional breakpoints. If a debug adapter does not support conditional breakpoints, a breakpoint which has a condition set is shown with an exclamation mark: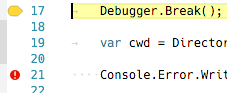
-
A boolean
supportsFunctionBreakpointsinCapabilitiesindicates whether the debug adapter implements function breakpoints. VS Code will only use the new function breakpoint request of the debug protocol if this feature is enabled. -
A boolean
supportsEvaluateForHoversindicates whether the debug adapter supports a side effect freeEvaluateRequest. If this feature is enabled, VS Code will use theevaluaterequest to populate the hover with information about the object under the mouse pointer. If it is disabled, VS Code uses the information from the Variables viewlet. -
An optional
exceptionBreakpointFilterscapability that lists the filters available for thesetExceptionBreakpointsrequest. With this, a debug adapter can contribute the options shown in the breakpoint viewlet: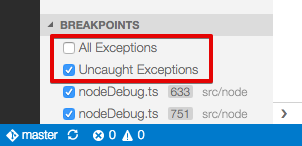
-
-
An optional
restartattribute has been added to theTerminatedEventwhich a debug adapter can use to request a session restart.
Notable Bug Fixes
- 105: Enable code folding and collapsing
- 439:
ext installis slow - 1228: Add option to convert tabs to spaces
- 2490: Improve IntelliSense perf
- 3127:
code .opens the current directory,code ..also opens the current directory - not the parent - 3894: [Handlebars] Curly braces edit issuess
- 3899: [folding] sections are still folded when disabled in preferences
- 3903: [js] syntax highlight for 'var' and 'function' not working in Default VS theme
- 3509: Smoke Test: Don't get cross file intellisense in JS
Here are the closed bugs and the closed feature requests for the February update.
Thank You
Last but certainly not least, a big Thank You! to the following folks that helped to make VS Code even better:
- sparecycles: fix replacing end of line with newline 2587.
- SamVerschueren: fix TextEditorOptions declaration 2935.
- Alexis Aubry: Updated Swift Autocompletion Syntax 3198.
- Xaver Hellauer: Fixes to C++ and C syntax 2649.
- mkosieradzki: Add support for jsonSchema integer type in IntelliSense 2844.
- SrTobi: Misc fixes in vsce: 65 71 73
VS Code Blog
You might not have noticed but we've moved the VS Code blog to our website. We hope you find this more convenient and easier to search across all of our documentation. Check out the recent post about the Chrome Debugger extension!