February 2021 (version 1.54)
Update 1.54.1: The update addresses an issue with an extension dependency.
Update 1.54.2: The update addresses these issues.
Update 1.54.3: The update addresses this issue.
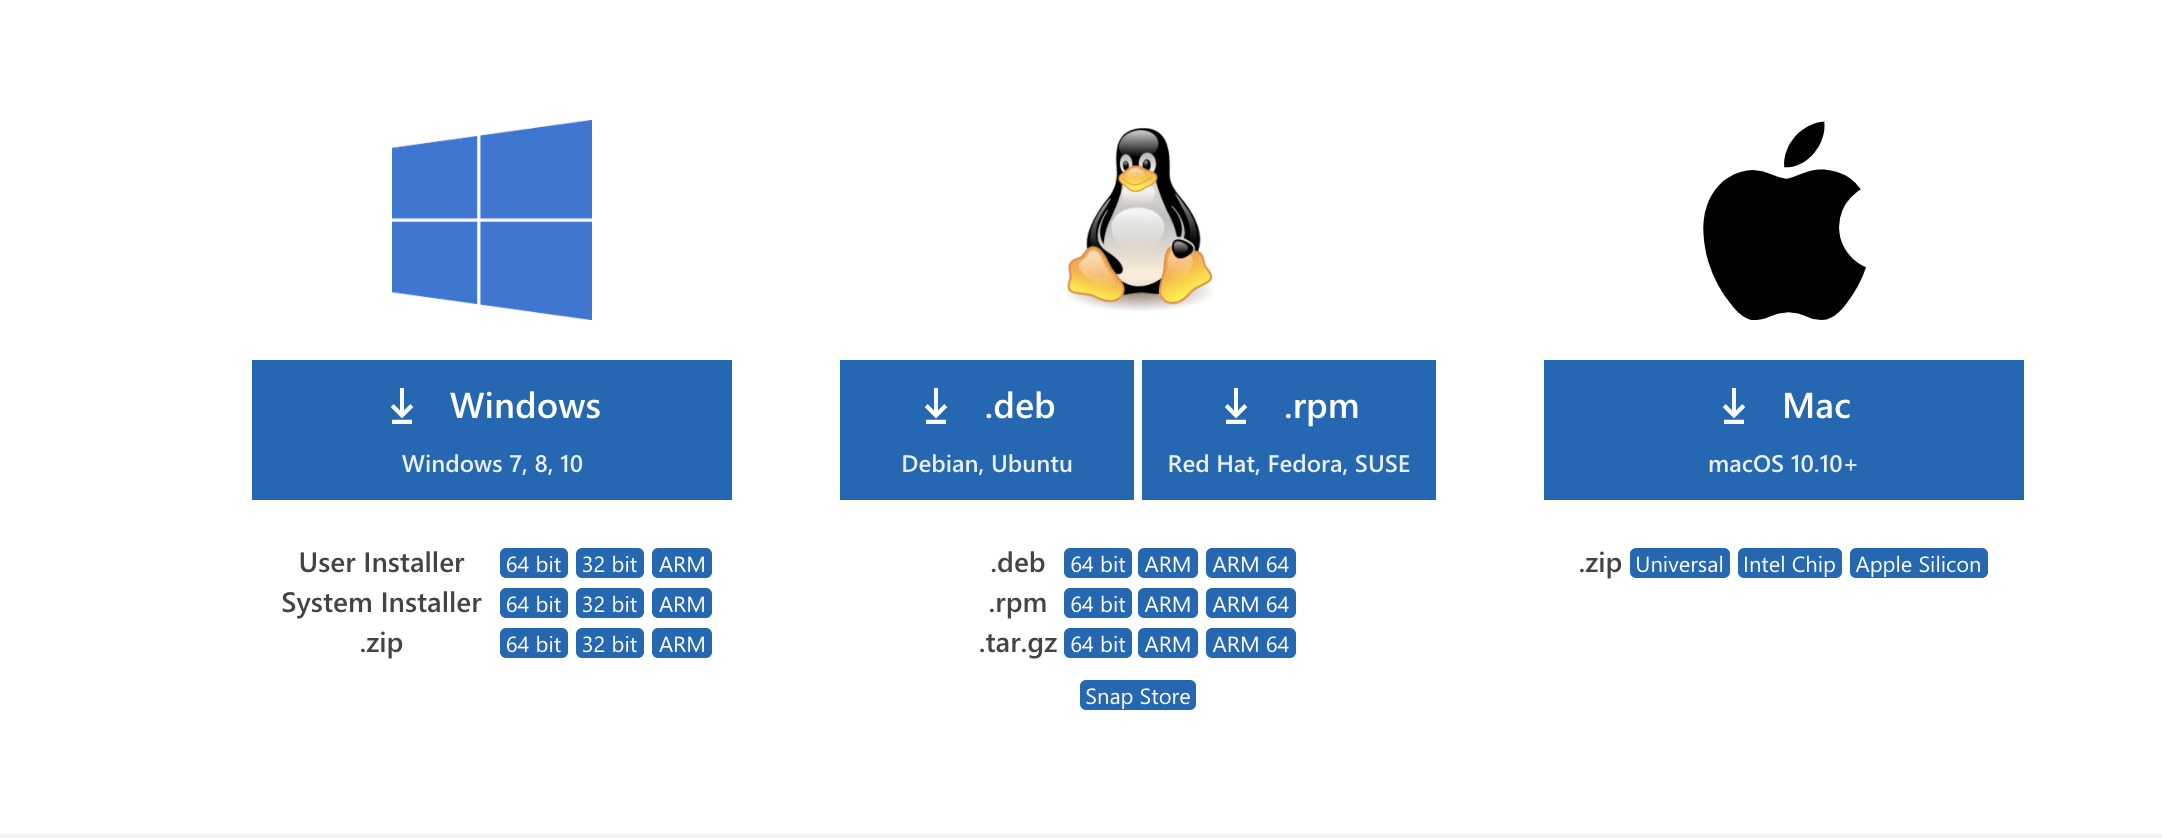
Downloads: Windows: x64 Arm64 | Mac: Universal Intel silicon | Linux: deb rpm tarball Arm snap
Welcome to the February 2021 release of Visual Studio Code. There are a number of updates in this version that we hope you will like, some of the key highlights include:
- Apple Silicon builds - VS Code is now available in stable for Apple Silicon.
- Accessibility improvements - Better word navigation on Windows and roles for views and buttons.
- Persistent terminal processes - Local terminal processes are restored on window reload.
- Product Icon Themes - Personalize your VS Code icon imagery with Product Icon Themes.
- Timeline view improvements - Compare changes across Git history timeline entries.
- Auto reload Notebooks - Notebooks automatically reload when their file changes on disk.
- Remote ports table view - Remote ports now shown in a table widget.
- Brackets extensions - Use Brackets keyboard shortcuts in VS Code.
- Troubleshooting extensions blog post - Learn to troubleshoot extensions using extension bisect.
If you'd like to read these release notes online, go to Updates on code.visualstudio.com.
Join us live at the VS Code team's livestream on Thursday, March 11 at 8am Pacific (4pm London) to see a demo of what's new in this release, and ask us questions live.
Insiders: Want to try new features as soon as possible? You can download the nightly Insiders build and try the latest updates as soon as they are available.
Apple Silicon
We are happy to announce our first release of stable Apple Silicon builds this iteration. Users on Macs with M1 chips can now use VS Code without emulation with Rosetta, and will notice better performance and longer battery life when running VS Code. Thanks to the community for self-hosting with the Insiders build and reporting issues early in the iteration.
The default download of VS Code for macOS is now a Universal build that runs natively on all Macs. On the Downloads page, you can find more links to architecture-specific builds for Intel or Apple Silicon, which are smaller downloads compared to the Universal package.

Accessibility
Toolbars and tabs occupy one tab stop
All toolbars in the workbench now follow the standard navigation behavior, so the toolbar occupies only a single position in the tab order, and is navigable with the arrow keys. Once the focus is on the toolbar, arrow keys should be used to move focus to a specific item in the toolbar. As a result of this change, the workbench has far fewer tab stops, making it easier to navigate across all the parts.
For consistency, the same change was applied to the tabs area. Thus the whole tab area is only one tab stop, and keyboard navigation between tabs should be done with the left and right arrow keys.
Word navigation on Windows
We have improved how word navigation is done on Windows to align with what Screen Readers on Windows expect from an Electron-based application. Now, when using word navigation, each word will be properly read out by the Screen Reader.
Due to this change, we are deprecating the following commands. They will still work, but we might remove them in the future.
cursorWordAccessibilityLeftcursorWordAccessibilityLeftSelectcursorWordAccessibilityRightcursorWordAccessibilityRightSelect
Non-Windows platforms already worked as expected, so we made no changes there.
Improved roles for views and buttons
Based on user feedback, we have improved the roles of multiple views and buttons across the workbench. Activity Bar, Side Bar, and Panel now have role:none, which will make the screen reader less chatty. Manage and Accounts buttons inside the Activity Bar now properly announce they have a popup.
Integrated Terminal
Retain terminal processes on window reload
Local terminal processes are now restored on window reload, such as when an extension install requires a reload. The terminal will be reconnected and the UI state of the terminals will be restored, including the active tab and split terminal relative dimensions.

This feature can be disabled by setting terminal.integrated.enablePersistentSessions to false.
Windows performance improvements
Thanks to the new terminal process layout, frequent pty data events from terminal processes should now process more quickly. This is expected to affect Windows more than other platforms due to the smaller events provided by conpty on Windows.
Automatically relaunch terminal requiring environment changes
Recently a new feature was rolled out that enabled extensions to influence the terminal's environment. This is used by various language extensions and the built-in git extension to enable VS Code as a git auth provided to negate the need to sign in. Previously the UX for this was to present a subtle ⚠️ icon in the top-right corner to indicate that a terminal's environment was stale. The indicator was subtle, since environment changes may or not be important.
We've tweaked this to automatically relaunch terminals that have stale environments when they have not yet been interacted with. This may result in some flickering, but extension terminal integration is much more seamless now. For example, the first terminal in a WSL window should no longer show a Git auth error, provided the relaunch happened before typing in the terminal.
Workbench
Emmet
The Wrap with Abbreviation and Wrap Individual Lines with Abbreviation commands have been merged into a single Wrap with Abbreviation command to reduce any confusion over which wrap command to use. Additionally, the Wrap with Abbreviation command now shows the preview whitespace properly.
The emmet.extensionsPath setting can now also take in an array of paths, rather than just a string. Therefore, when combined with Settings Sync, one can point to different snippet files depending on the machine they are on, without having to update the setting per machine.
Product Icon Themes
The first Product Icon Themes have become available in the Extension Marketplace. Thanks to the theme authors for the great work!
To select or find a theme, use the Preference: Product Icon Theme command from the command prompt or the Settings gear.
![]()
IntelliSense for context keys
VS Code uses when-clauses to enable and disable keybindings. Extensions also use when-clauses to control menu- and view-contributions. Authoring these when-clauses is now much simpler because the editor offers completions for them.
 Theme: GitHub Light Theme, Font: FiraCode
Open Editors New Untitled File action
There is now a New Untitled File action in the Open Editors view title area.

Updated application menu settings
The window.menuBarVisibility setting for the application menu visibility has been updated to better reflect the options. Two primary changes have been made.
First, the default option for the setting has been renamed to classic.
Second, the Show Menu Bar entry in the application menu bar now toggles between the classic and compact options. To hide it completely, you can update the setting, or use the context menu of the Activity Bar when in compact mode.
 Theme: GitHub Light Theme
Webview caching improvements
We've improved caching for a local file inside a webview. If a webview reloads a file from disk, then we now use ETags to avoid reading the file again if it has not changed. This can eliminate data transfer, and improves response time, especially for remote workspaces.
This caching currently only applies when an existing webview reloads a resource. It does not apply to newly created webviews, even if that webview belongs to an extension that previously created a similar webview.
Changes to workspace search actions
We have modified the existing workbench.view.search to no longer place the selected text into the search input, but instead open the input. To create a new search using the selected text and respecting the search.mode setting, workbench.action.findInFiles should be used.
Modifier only keybindings
It is now possible to define keybindings for duplicate modifiers, for example, shift shift, alt alt, ctrl ctrl or cmd cmd / meta meta / win win. These keybindings can be entered manually in keybindings.json, for example:
{ "key": "shift shift", "command": "workbench.action.quickOpen" }
Updated list/tree UI
We have updated the list/tree styles to match native focus and selection indicators: focused elements will now be rendered with an outline color.

Breaking change
Theme publishers are advised to adopt this style as well simply by swapping the customization of the list.focusBackground color for the quickInput.list.focusBackground color. To see an example, check out this commit.
Table widget
We introduced a new table widget, built on top of the existing list widget, so we can render tabular data with the same performance as we can render list elements. For now, it is used in the Ports view for our Remote features.

Getting Started
We are experimenting with a new editor to show on startup, called the Getting Started editor. This is intended to make some of VS Code's features more approachable to new users. Some Insiders users may have already seen it, and it will be slowly rolled out to more Stable users over the course of this iteration. You can always opt in or out of the new behavior by modifying the workbench.startupEditor setting to or away from gettingStarted.

Timeline view
You can now compare changes across Git history timeline entries, using the Select for Compare and Compare with Selected commands—similar to comparing files in the Explorer view. This feature lets you quickly see all the changes between any two commits in your Git file history.

Default sash hover border color
In the 1.52 release, we introduced the hover border color token for sashes (sash.hoverBorder), but did not set a default. We now show this color by default on all themes.

Debugging
Breakpoints view improvements
New inline action for removing breakpoints
We have added an inline action X to remove breakpoints in the Breakpoints view. This action should make it easier to remove breakpoints.

Help text support for exception filters
Recently we have added support for editing conditions on exception filters in the Breakpoints view.
In order to make these conditions more discoverable and their syntax self-explanatory, VS Code now shows a hover on the exception filter and a placeholder text in the condition text box.
Since the information for both is provided by the underlying debug extension, it can be much more specific (and thus helpful) than some generic message.
Since this new feature is based on additions to the Debug Adapter Protocol (see below), it requires an opt-in of debug extensions. In this release, only VS Code's built-in JavaScript debugger supports the new feature.

New settings and other improvements
Collapse identical lines in the Debug Console
There is a new setting, debug.console.collapseIdenticalLines, that controls if the Debug Console should collapse identical lines and show many occurrences with a badge. The default is to collapse.
Control which editors to save before debugging
There is a new setting, debug.saveBeforeStart, that controls what editors to save before debugging starts. This setting has the following values:
allEditorsInActiveGroup: Save all editors in the active group. The default value.nonUntitledEditorsInActiveGroup: Save all editors in the active group except untitled ones.none: Don't save any editors.
This setting is useful for PowerShell debugging since the PowerShell debugger supports debugging unsaved files.
Improved Enablement for Restart Frame action
With a new addition to the Debug Adapter Protocol debug extensions are now able to communicate to the VS Code UI whether the "Restart Frame" action is available on a selected stack frame. VS Code now disables the restart frame inline action in the Call Stack view for stack frames that cannot be restarted.
For example JS-Debug extension has adopted this and now async stack traces disable the restart frame action.
Languages
TypeScript 4.2
VS Code now ships with TypeScript 4.2.2. This major update includes many TypeScript language improvements, along with many improvements and bug fixes for JavaScript and TypeScript tooling.
You can read more about TypeScript 4.2 on the TypeScript blog.
Quick Fix to declare missing functions
The new Add missing function declaration Quick Fix stubs out missing functions. For example, if we have a call to a missing function add:
const x: number = add(1, 2);
Using Add missing function declaration on add results in:
const x: number = add(1, 2);
function add(arg0: number, arg1: number): number {
  throw new Error('Function not implemented.');
}
You can use this Quick Fix while writing code to quickly stub out a function based on a call signature.
To use this Quick Fix in JavaScript, you must enable type checking.
JS Doc templates now generate @returns
JS Doc templates now automatically include @returns if the function being annotated includes a return statement. For example, for the function getViz:
function getViz(el) {
  return el?.viz;
}
The generated JSDoc template is:
/**
 *
 * @param {*} el
 * @returns
 */
function getViz(el) {
  return el?.viz;
}
You can disable @returns in JSDoc comments with javascript.suggest.jsdoc.generateReturns and typescript.suggest.jsdoc.generateReturns.
Deprecated DOM APIs are now marked
Deprecated DOM methods are now marked as deprecated in suggestions and in code:

You can disable showing deprecated properties and functions in the editor by setting editor.showDeprecated: false.
Notebooks
Automatically reload notebooks
Notebooks now automatically reload when their file changes on disk and when they don't have unsaved changes. This should make it much simpler to work with notebooks that are under version control.
Improved focus for large cells
When a large notebook cell is focused, you can now better tell which cell is focused when the top and bottom of the cells are out of view. We now show a border on the left and right side of the focused cell.

Hovers in CSS/LESS/SCSS and HTML
You can now fine-tune the content of hovers in HTML and CSS to:
- Not show the documentation from MDN
- Not show the link to the MDN page
Use the settings css.hover.documentation and css.hover.references to change the hovers for CSS. Replace css with html, css, scss or less to change the settings for those languages.
Preview features
Extensible Markdown renderers for notebooks
This iteration, we explored making the Markdown renderer for notebook cells extensible. In the screenshot below, for example, we've extended VS Code's Markdown renderer to support showing math formula in notebook cells:

In order to make our Markdown renderer extensible, we explored using Markdown It to render all notebook Markdown. We also explored moving the rendered Markdown into the backlayer webview of the notebook.
While we aren't yet ready to open up an official API for this, we plan on continuing this exploration in March. You can also try out the new extensible Markdown renderers today with the undocumented notebook.experimental.useMarkdownRenderer: true setting.
Contributions to extensions
Brackets
Developers coming from the Brackets source code editor can keep using their same keyboard shortcuts in VS Code with the Brackets Keymap extension. There is also a Brackets Extension Pack, which bundles extensions for working with CSS and creating live previews.

GitHub Pull Requests and Issues
Work continues on the GitHub Pull Requests and Issues extension, which allows you to work on, create, and manage pull requests and issues.
To learn about all the new features and updates, you can see the full changelog for the 0.24.0 release of the extension.
Remote Development
Work continues on the Remote Development extensions, which allow you to use a container, remote machine, or the Windows Subsystem for Linux (WSL) as a full-featured development environment.
Feature highlights in 1.54 include:
- Ports view table layout
- Remote - SSH: X11 Forwarding
- WSL: Improved WSL 2 support
You can learn about new extension features and bug fixes in the Remote Development release notes.
Extension authoring
Limits for editor title menu and "run" submenu
The space in the editor toolbar (editor/title) is limited. Therefore, we have
- implemented an overflow behavior. When the primary group, that is, the group of actions that get rendered with icons, exceeds nine commands then all additional commands overflow into the
...menu. - added the
editor/title/runsubmenu. We ask extension authors to contribute run- and debug-commands into this menu, not into theeditor/title-menu anymore as we had recommended in a previous release. In addition, it is no longer necessary to use the magic group values1_run@10and1_run@20in order to make the commands show up in the correct position.

Also know that the run submenu is dynamic, will replace itself with its first child when that's the only child.
Authentication Provider API
You can now register an authentication provider, which can be used by other extensions to perform authentication against a service.
New feedback channel for the Extension Marketplace
There's a new public repository for issues related to the Extension Marketplace. If you have technical issues, want to give feedback, or have feature requests, please open an issue.
Updated codicons
We've added the following new icons to our codicon library:
debug-rerungathergit-pull-request-createnotebook-templaterun-aboverun-belowtype-hierarchytype-hierarchy-subtype-hierarchy-supervariable-group

We've also updated the following icons to be consistent:
debug-alt-smalldebug-altdebug-rerunplay-circleplayrun-aboverun-allrun-below

Proposed extension APIs
Every milestone comes with new proposed APIs and extension authors can try them out. As always, we want your feedback. This is what you have to do to try out a proposed API:
- You must use Insiders because proposed APIs change frequently.
- You must have this line in the
package.jsonfile of your extension:"enableProposedApi": true. - Copy the latest version of the vscode.proposed.d.ts file into your project's source location.
You cannot publish an extension that uses a proposed API. There may be breaking changes in the next release and we never want to break existing extensions.
Icon contribution point
The icon contribution point allows extensions to define a new icon by ID, along with a default icon.
That icon ID can then be used by the extension (or any other extensions that depend on the extension) at the places where ThemeIcon can be used:
In Markdown strings (for example, "$(distro-ubuntu)" Ubuntu 20.04") and at all places that take a ThemeIcon (for example, new ThemeIcon("distro-ubuntu")).
Product icon themes can redefine the icon (if they know about the icon ID).
For more information, see issue 114942 for details and to provide feedback.
Inline value provider API
Today the Show Inline Values feature of VS Code's debugger is based on a generic implementation in VS Code core, and doesn't provide customizability through settings or extensibility via extensions. As a consequence, it is not a perfect fit for all languages and sometimes shows incorrect values because it doesn't understand the underlying source language. For this reason, we are working on an extension API that allows to replace the built-in implementation completely or to replace parts of the implementation with custom code.
In this milestone, we've made a first implementation of the proposed API available.
Here is the inline values provider API in a nutshell:
- an
InlineValuesProvidermust be registered for a language. - for a given document the
InlineValuesProvidermust locate all language elements for which inline values should be shown. - for every element an
InlineValuedescriptor object must be returned which instructs VS Code what information to show. Currently three types ofInlineValueobjects are supported:InlineValueText: the complete text to be shown,InlineValueVariableLookup: the name of a variable that VS Code will try to look up in the VARIABLES view to find its value. The name and the value are then shown in the form "name = value",InlineValueEvaluatableExpression: an expression that VS Code will send to the debugger for evaluation. The expression and the result are then shown in the form "expression = result".
The following snippet (from Mock Debug) shows a minimal inline values provider for "markdown" files that uses a regular expression to locate "variables" and then instructs VS Code to find their values via the Variables view:
vscode.languages.registerInlineValuesProvider('markdown', {
  provideInlineValues(
    document: TextDocument,
    viewport: Range,
    context: InlineValueContext
  ): ProviderResult<InlineValue[]> {
    const allValues: InlineValue[] = [];
    for (let l = 0; l <= context.stoppedLocation.end.line; l++) {
      const line = document.lineAt(l);
      var regExp = /local_[ifso]/gi; // match variables of the form local_i, local_f, Local_i, LOCAL_S...
      do {
        var match = regExp.exec(line.text);
        if (match) {
          const varName = match[0];
          const varRange = new Range(l, match.index, l, match.index + varName.length);
          allValues.push(new InlineValueVariableLookup(varRange, varName));
        }
      } while (match);
    }
    return allValues;
  }
});
And now the inline values provider in action:

If you want to provide feedback for this proposed API, please add comments to this issue.
Testing
We continued to make progress on testing in VS Code. This month we focused on refining the base experience in VS Code and the extension APIs. We have also published some provisional documentation on testing, which will be fleshed out as the APIs continue to stabilize.
Language Server Protocol
A first proposal of a diagnostic pull model got implemented for the upcoming 3.17 release. The proposal is available in the next versions of the VS Code LSP libraries.
Debug Adapter Protocol
More help text properties for ExceptionBreakpointsFilter
Two optional UI attributes description and conditionDescription have been added to the ExceptionBreakpointsFilter.
With these attributes, clients can display additional information about exception breakpoints. The description property could be displayed in a hover
and the conditionDescription could be used as a placeholder text for a text box where the condition can be edited.
Improved description for setExceptionBreakpoints request
We have improved the description of the setExceptionBreakpoints request by adding guidance for what an adapter should do if the user inputs an invalid exception breakpoint condition.
New canRestart property for stack frames
A new optional boolean property canRestart has been added to the stack frame. It indicated whether the stack frame can be restarted with the restart request.
Based on this information a client can enable or disable a Restart Frame context menu action.
Engineering
Progress on Electron sandbox
This milestone we continued to make the VS Code window ready for enabling Electron's sandbox and context isolation features.
Specifically:
- We were able to move some of the native module requirements we have in the renderer to other processes.
- The
MessagePortcommunication channel was implemented to work when sandbox is enabled.
New terminal process layout
Terminal processes are now spawned under a new "pty host" process, instead of the window process. This change is not only part of the Electron sandbox but should also improve stability and performance of the terminal.
Windows installers published to Windows Package Manager
Windows user and system installers for x86 and x64 are now being published to the Windows Package Manager. You can use the winget tool to search for all Visual Studio Code installers - winget search vscode, and install any of the published installers.
Building VS Code using TypeScript 4.3
VS Code now is built using a nightly build of TypeScript 4.3. This lets us validate the TypeScript team's latest work and also provide feedback on new changes.
The latest TypeScript version already helped us catch a few cases where we were missing awaits in conditionals.
Prevent yarn.lock changes
We now have CI that prevents PRs against yarn.lock files, in order to improve supply chain security.
Default branch: main
We have started renaming the default branch of all our repositories to main, including microsoft/vscode. We are about 60% finished with this effort.
Documentation
VS Code and Python in the classroom
Read the case study of a Computer Science professor at Harvey Mudd College, who uses VS Code in his introductory CS classes with Python. Learn about the settings he recommends for his students, as well as helpful extensions and free self-paced Python and Data Science lessons.
Troubleshooting extensions blog post
Everybody loves installing and using VS Code extensions. However, when you have lots of extensions installed, sometimes the editor can start to act "funny" and it would be great to know if the behavior is caused by a specific extension. If you missed the earlier announcement of the extension bisect utility, you can read this "Resolving extension issues with bisect" blog post, which describes how you can quickly troubleshoot "bad" extensions and even help the extension author(s) with feedback.
Notable fixes
- 100151: menu key applied to the wrong item in explorer
- 112055: Debug opens a new integrated terminal for each Python session
- 114881: Preserve symlinks when copying folders or files
- 114933: "Task cannot be tracked" frustration
- 115922: Cursor keys not working for filtering in File Explorer
- 116037: No Link hovers shown for output in the Debug Console
- 116101: I can't find target command in command search because the English description has disappeared
- 116932: Throwing custom exceptions from contributed command execution shows cryptic error popup
Thank you
Last but certainly not least, a big Thank You to the following people who contributed this month to VS Code:
Contributions to our issue tracking:
- John Murray (@gjsjohnmurray)
- Andrii Dieiev (@IllusionMH)
- Simon Chan (@yume-chan)
- ArturoDent (@ArturoDent)
- Alexander (@usernamehw)
Contributions to vscode:
- @antonvolokha (Anton Volokha): Fix issue #116591 PR #116885
- @CameronIrvine (Cameron): Fix #114432: Multiple save dialogs appearing on Windows if Ctrl+S is pressed multiple times PR #114450
- @davidbailey00 (David Bailey): RPM: Don't generate build_id links PR #116105
- @DonJayamanne (Don Jayamanne): Ensure Notebook Cell runState is updated correctly PR #116901
- @engelsdamien (Damien Engels): Explicitly list out tsec exemption PR #116460
- @ferenczy (Dawid Ferenczy Rogožan): Corrected typo in the localization string wordBasedSuggestionsMode PR #115809
- @gjsjohnmurray (John Murray): Improve guidance commentary in GH Bug Report template PR #116183
- @guiherzog (Guilherme Herzog): Improving performance of tree traversal on getViewState function PR #115387
- @habibkarim (Habib Karim): Handle normalized absolute file paths on markdown preview link click PR #116649
- @jeanp413 (Jean Pierre)
- Fixes #115922 PR #116005
- Emmet: add output.reverseAttributes option PR #116088
- Fix vscode becomes unresponsive after pasting filename with many dots in explorer PR #116268
- Consolidate
wrapWithAbbreviationandwrapIndividualLinesWithAbbreviationin one command PR #116603
- @jogo-: Fix spelling in papercuts.github-issues PR #115452
- @Klagopsalmer (Alexandre Schnegg): Fixes #95040 PR #116027
- @lancewl (Hsuan-An Weng Lin)
- Emmet: add css.color.short setting PR #116912
- Emmet: add support of multiple extensions path PR #117105
- @leereilly (Lee Reilly): Add period to list item for consistency PR #115375
- @manuth (Manuel Thalmann): Allow Markdown-Rendering Without Providing an Env-Parameter PR #117041
- @mdesrosiers (Martin Desrosiers): Update marked to 2.0.0 PR #117714 (https://github.com/microsoft/vscode/pull/115192)
- @MarcoZehe (Marco Zehe): Upgrade Playwright to v1.8.0. PR #115241
- @nrayburn-tech (Nicholas Rayburn): Rename function in git extension PR #113673
- @obsgolem (Josiah Bills): Added a new "blankLine" option for move units PR #115578
- @pfitzseb (Sebastian Pfitzner): Add Julia grammar PR #115309
- @PathToLife (PathToLife): Feature: Shift Shift, Ctrl Ctrl, Alt Alt Keybinds (Double press modifer keybind support) PR #115190
- @rluvaton (Raz Luvaton): fix(workbench): add forgotten escaping in regex PR #115336
- @samrg123 (Samuel Gonzalez): Fixed issue #108301 by escaping URI before creating a MarkdownString. PR #112330
- @sargreal (Felix Haase): remove colon from git host in askpass arguments PR #117230
- @shskwmt (Shunsuke Iwamoto)
- Fixes 114236: Add a multi-line comment regex to unIndentedLinePattern PR #114478
- Fixes 115154: Add "overflow: hidden" style to split-view-view PR #115345
- @susiwen8 (susiwen8)
- Fix: add alwaysConsumeMouseWheel for list PR #114182
- Fix: wrong event for
onDidSaveNotebookDocumentPR #115855
- @SchoofsKelvin (Kelvin Schoofs): Fix issue #114473 PR #114474
- @tspence (Ted Spence)
- Allow issue service to display a bug report window when remote extension host is crashed PR #116896
- Fix webview focus issues that prevent cut/copy/paste when opening files with a quick pick PR #116899
- @TacticalDan: Reduce arbitrary event limiter from 16ms down to 4.16666 (#_107016) PR #114957
- @ugultopu (Utku Gultopu): Fix misspelling of "likelihood" PR #116728
- @vagusX (vagusX): fix: prevent scroll when list focused in zone-widget PR #114912
- @Wscats (Eno Yao): Supplementary function parameter types PR #115751
Contributions to language-server-protocol:
- @DanTup (Danny Tuppeny): Fix reference to insertReplaceSupport capability PR #1207
- @reznikmm (Maxim Reznik): Minor fix in MD formatting PR #1208
Contributions to vscode-languageserver-node:
- @xAlien95 (Stefano De Carolis): Fix broken doc markdown link PR #741
Contributions to vscode-emmet-helper:
- @aliasliao (Liao Jinyuan): provide completions for pascal-case tags when typing jsx PR #53
- @AnuBhar (Anushka Bhargava): Fix for 114923 - HTML figcaption tag should be suggested when using the full word PR #44
- @jeanp413 (Jean Pierre)
- @johnsoncodehk (Johnson Chu): fix: doComplete result may be undefined PR #51
- @lancewl (Hsuan-An Weng Lin)
- @shskwmt (Shunsuke Iwamoto): Fixes 115946(vscode): Add '{' to htmlAbbreviationStartRegex PR #45
Contributions to vscode-html-languageservice:
- @sapphi-red (翠 / green): Remove existing attribute from autocomplete suggestions PR #99
Contributions to vscode-js-debug:
Contributions to vscode-textmate:
- @msftrncs (Carl Morris): Improve endless loop detection PR #146
Contributions to vscode-vsce:
- @felipecrs (Felipe Santos): Add verify-pat command PR #532