The Coding Harness Behind GitHub Copilot in VS Code
May 15, 2026 by Julia Kasper, Megan Rogge and Aaron Munger
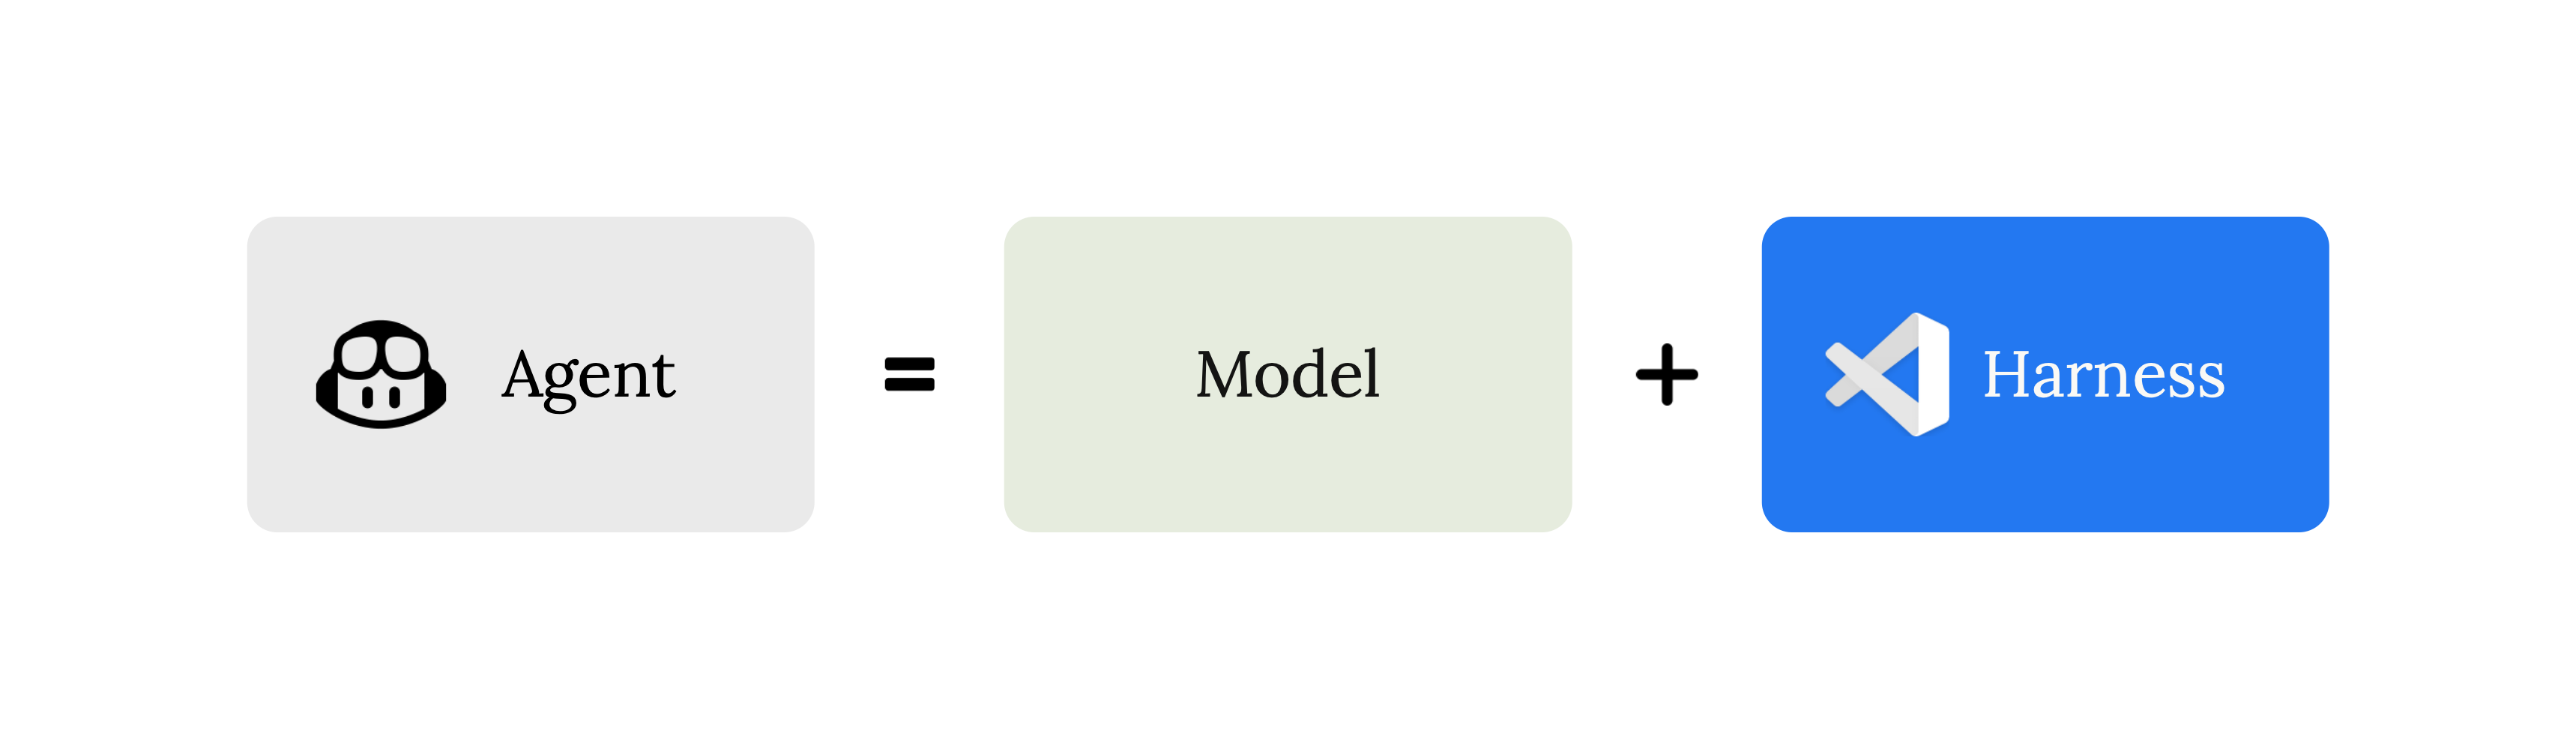
With each new model release, the same conversation is reignited. Which model is the smartest? Which one is fastest? Which one should we use? Those are useful questions, but for a product like Visual Studio Code the model is only one part of the agentic coding experience. What developers actually interact with is the coding harness: the layer that assembles context, exposes tools, runs the agent loop, interprets tool calls, and turns a model's output into something useful inside the editor. In this post, we'll look at what that harness does, why it matters, and how we evaluate it as models and developer workflows evolve.
What is the coding harness?
Language models do not edit files, execute commands, or run tests by themselves. They can only produce text. The coding harness is the system that acts as a bridge between the code editor and the language model. It turns that text into action and feeds the results back so the model can decide what to do next.
In VS Code, the coding harness has three main responsibilities:
-
Context assembly: Before any request reaches the model, the harness builds a prompt. That prompt includes a system message with behavioral instructions, the user's query, workspace structure (languages, frameworks, open editors), conversation history from prior turns, tool results, custom instructions, and memory from earlier sessions. The harness decides what the model sees, and those decisions directly affect quality.
-
Tool exposure: The harness declares the tools the model is allowed to call: reading files (
read_file), editing code (replace_string_in_fileorapply_patch), running terminal commands (run_in_terminal), searching the codebase (semantic_search), and many more. Each tool has a JSON schema the model must follow and a description the model uses to decide when to invoke it. The set of available tools can change per request. Some tools are only enabled for certain models, some require user confirmation before execution, users can toggle tools on and off in the tool picker, MCP servers and extensions can contribute entirely new tools that slot into the same loop, and custom agents (.agent.md) can restrict their tool set to a specific subset. -
Tool execution: When the model requests a tool to be run (using JSON like
{"name": "run_in_terminal", "arguments": {"command": "npm test"}}), the harness is the one that validates the arguments, runs the tool, handles errors, formats the result, and feeds it back in the next iteration. For example, if the model asks to edit a file, the harness writes the diff. If the model asks to run a shell command, the harness is what spawns the process, captures output, and relays it.
None of these tasks can be directly achieved by the language model. However, this input determines the behavior and outcome of the model and what you experience in the code editor.
The logic that orchestrates these tasks, deciding when to continue or stop iterating and how to keep the conversation coherent across many rounds, is the agent loop.
The agent loop
At its core, when you use an agent in VS Code, a tool-calling loop happens: a "think → act → observe → think again" cycle. On each iteration, the agent harness builds the prompt (system instructions + context + history + all tool results so far), sends it to the model, and checks the response. If the response includes tool calls, the harness executes those tools, captures their results, and loops back. If there are no tool calls, the loop can finish and the assistant’s text becomes the final response.
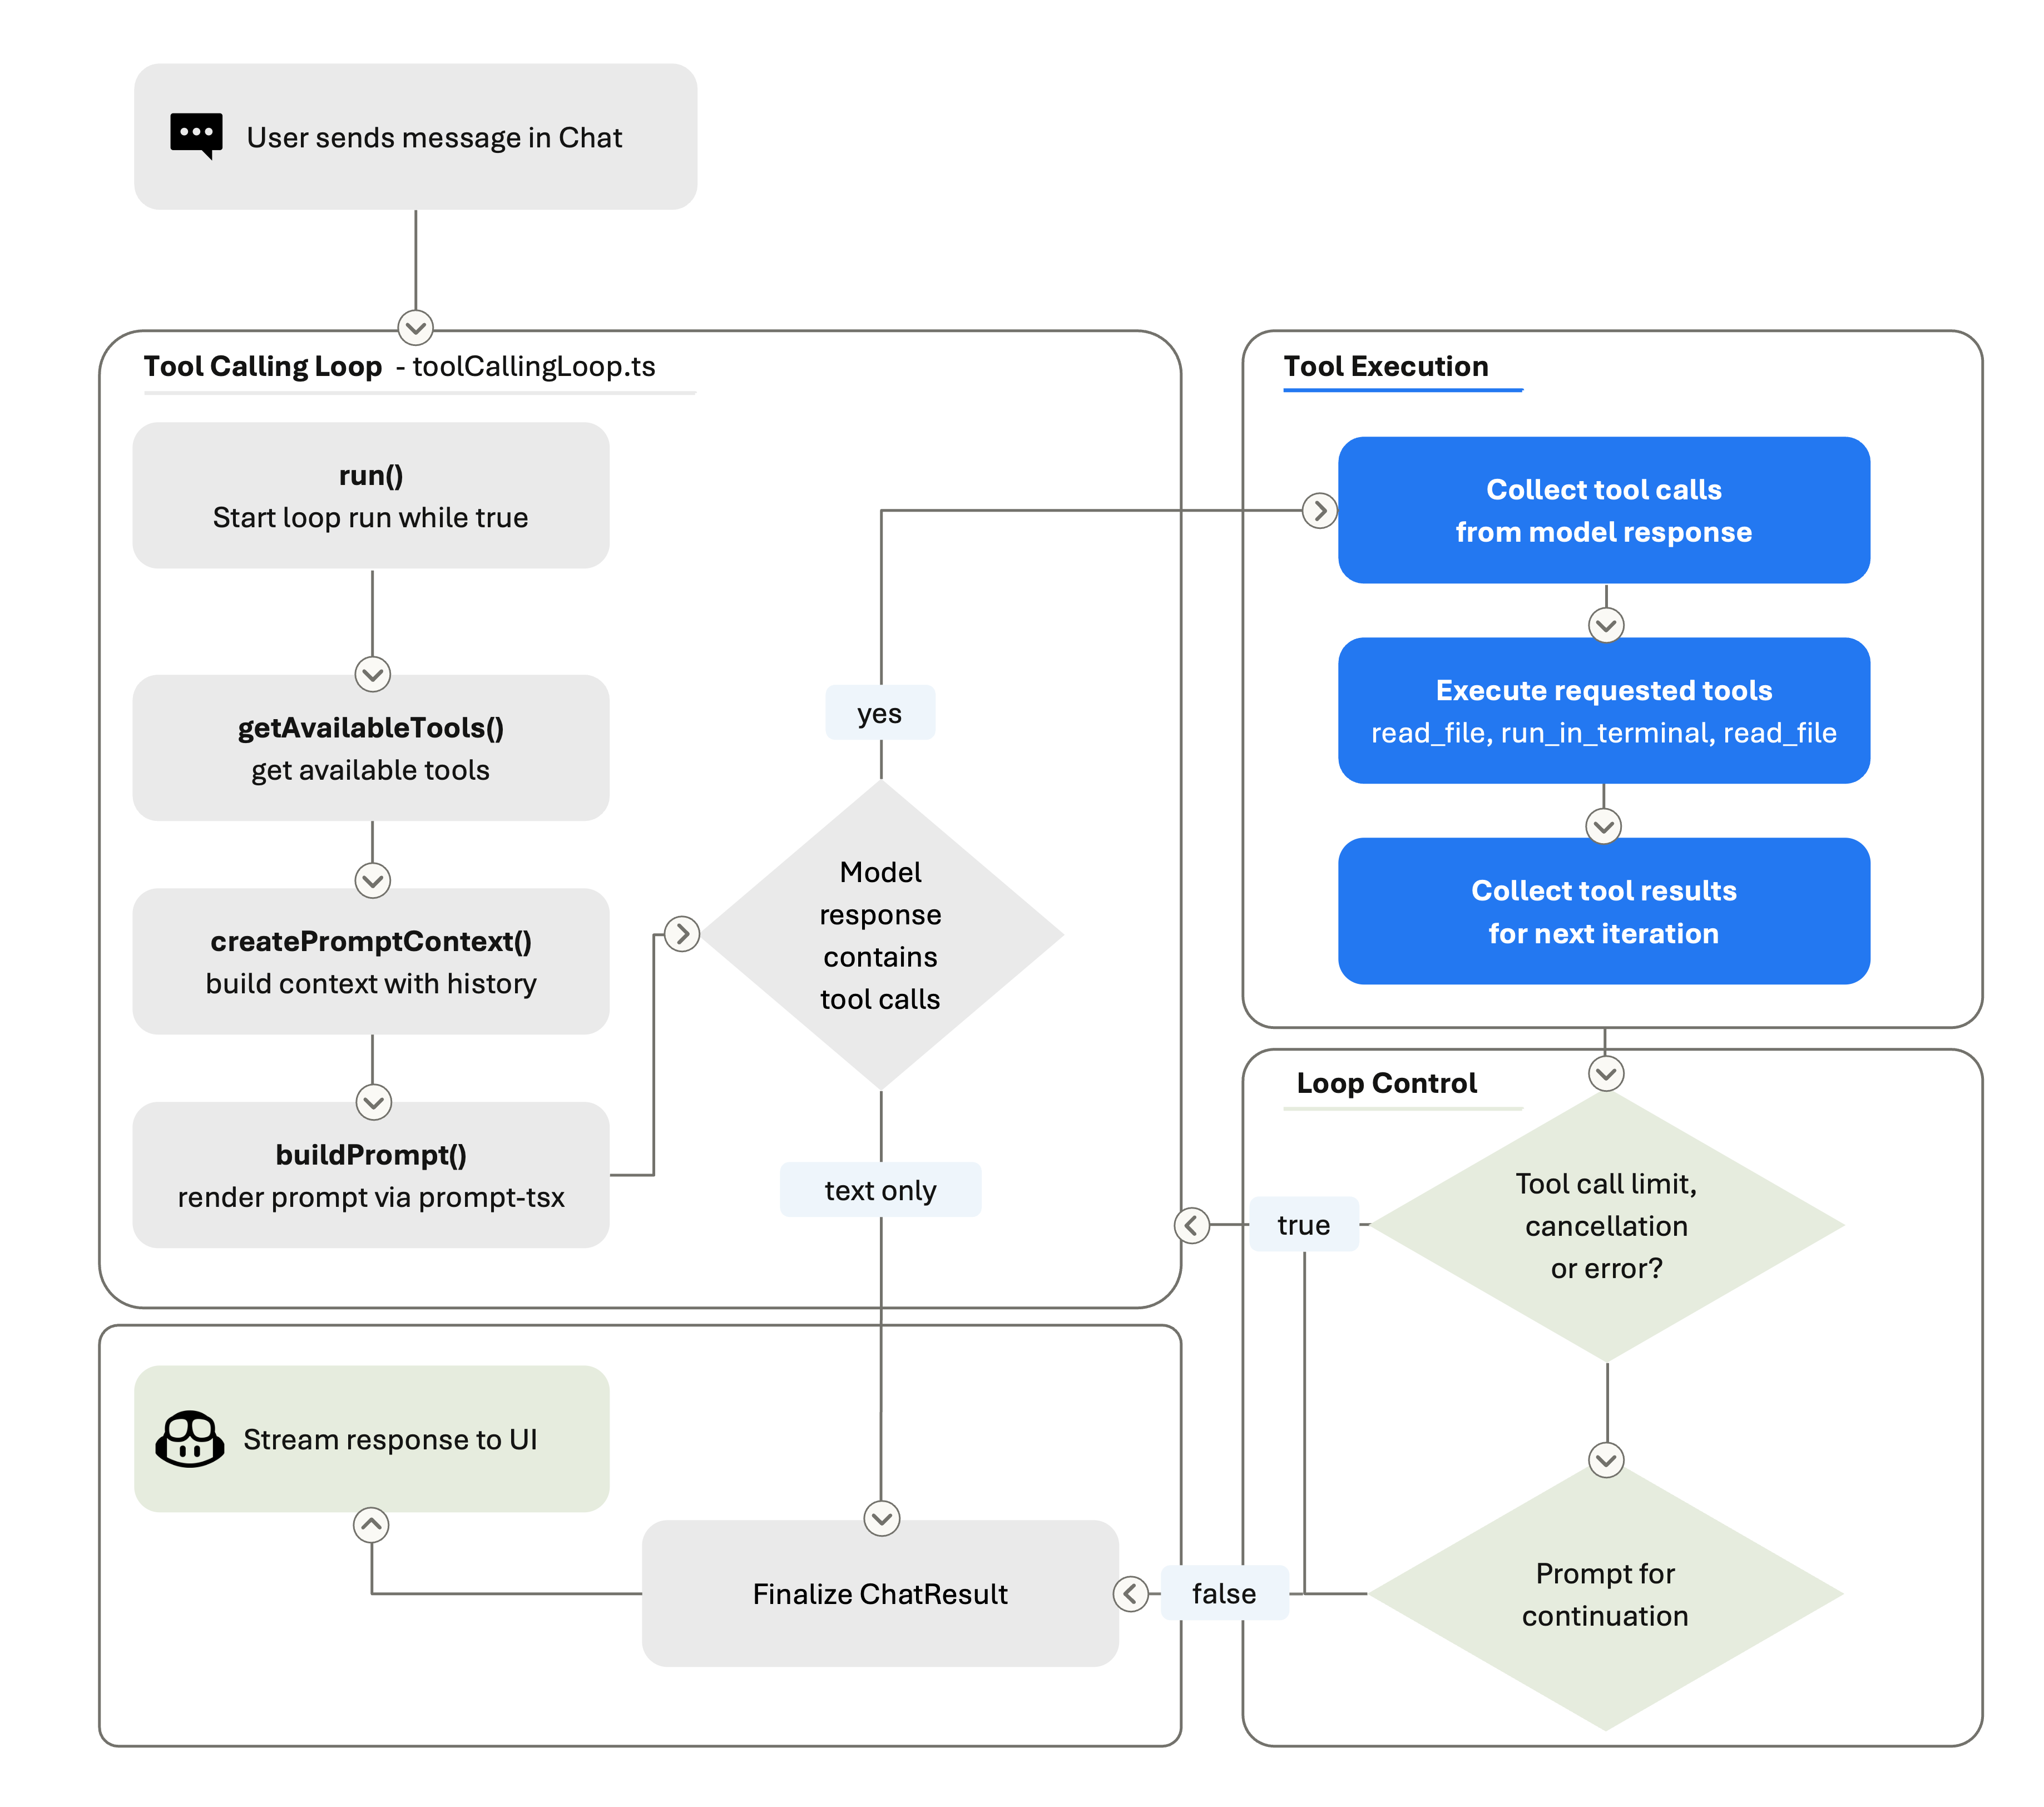
A turn is the user-visible chat exchange: you send one message, and the agent eventually produces a response. During that turn, the agent loop may perform many rounds. A round is one pass through the loop: build the prompt, call the model, receive text and/or tool calls, execute any tools, record the results, and decide whether to continue. The full execution of all those rounds is the loop’s run. A single user turn might trigger many rounds as the model searches files, reads code, edits files, runs tests, reads the output, and iterates on failures.
The tool-calling loop is bounded by loop-control checks. We enforce a tool-call limit, check for cancellation between rounds, and run stop hooks. Stop hooks are extension points that can inspect the agent state and either allow it to finish or push it to keep working. Within the loop, the prompt is rebuilt on every iteration. That means the model always sees the latest state of the workspace: if it edited a file three rounds ago, the current prompt reflects that edit. The harness also manages conversation summarization. When the accumulated history grows too large, it compresses earlier rounds into a summary so the model can keep working without hitting the context window ceiling.
Note: Want to see the harness in action? You can explore the VS Code source code, use the Tools UI in Chat to review the tools available for a request, and open the Chat Debug View to inspect the prompts, tool calls, and results.
The harness is the product
When a new model ships, it needs to fit into an existing harness. The system prompt, the tool definitions, the loop logic, the context assembly, all of it was built and tuned over many months of real-world use. The model gets better at filling in the blanks, but the harness defines what the blanks are.
This matters even more because GitHub Copilot lets you use models from multiple model providers. And GitHub Copilot in VS Code supports a growing model ecosystem. Developers can switch between models, use auto-selection, bring their own keys, or install extra providers via extensions. This means that VS Code has to deal with a broad and continuously evolving ecosystem, not a single stable API.
The harness is what enables VS Code to handle this model flexibility without forcing developers to relearn the product every time. You should be able to switch models or try a new provider while keeping the core experience familiar: chat, sessions, tools, terminal output, debugging, and source control.
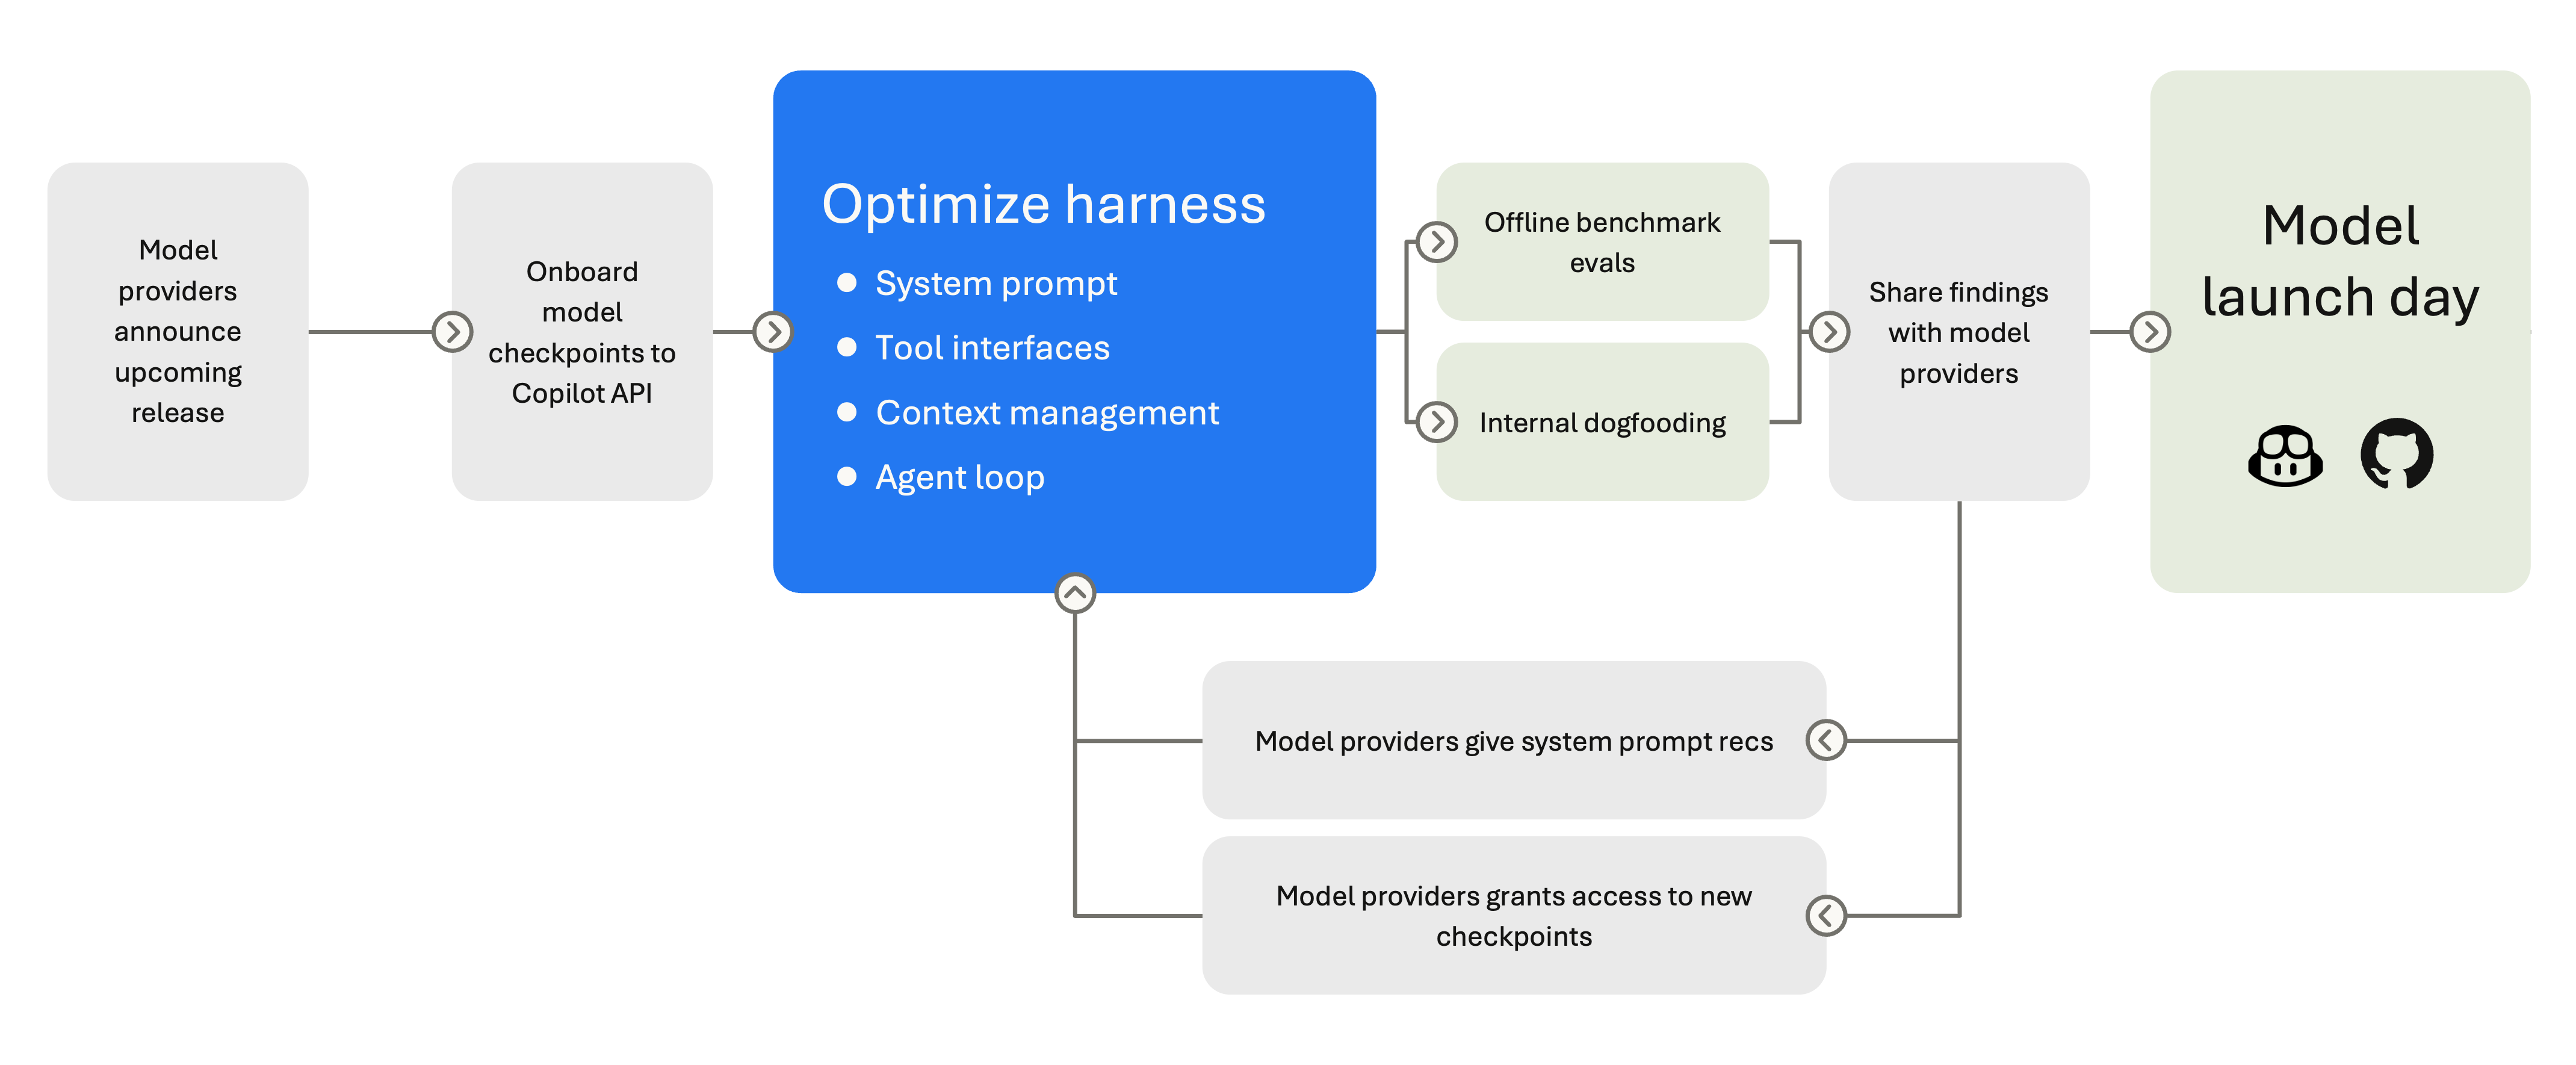
But integrating a new model is rarely just adding an extra option to the model picker. Providers differ in how they expose tool calling, structured outputs, reasoning controls, prompt caching, context limits, and error behavior. Some models are better at long planning. Some are better at terse edits. Each model has different strengths, and we work closely with model providers before each release to adapt the system prompt, tool descriptions, and loop behavior accordingly. Providers often grant us early access to new model checkpoints, which are pre-release snapshots of upcoming models, so we can start tuning the harness before the model is generally available.
Different models need different harness behavior. Claude models use replace_string_in_file for edits; GPT models use apply_patch. Gemini needs reminders to use tool-calling instead of narrating it, and breaks on orphaned tool calls in history. Some models support extended thinking and need reasoning-effort controls. Some work best with a concise system prompt; others need verbose, structured instructions to stay on track. The harness selects different system prompts per model - Claude Sonnet 4 gets a different prompt than Claude 4.5, which gets a different one than Opus.
All these per-model differences aren't trivial. They translate into per-model system prompts, per-model tool sets, and per-model conversation management. This means that when a new model ships, we can't just flip a switch but we need to validate its behavior. We validate tool schemas, retune defaults, and re-run full agent sessions before anything ships. Beyond the model functioning correctly, the harder question is how can we verify that a new model actually gives better results.
Evaluation keeps the harness honest
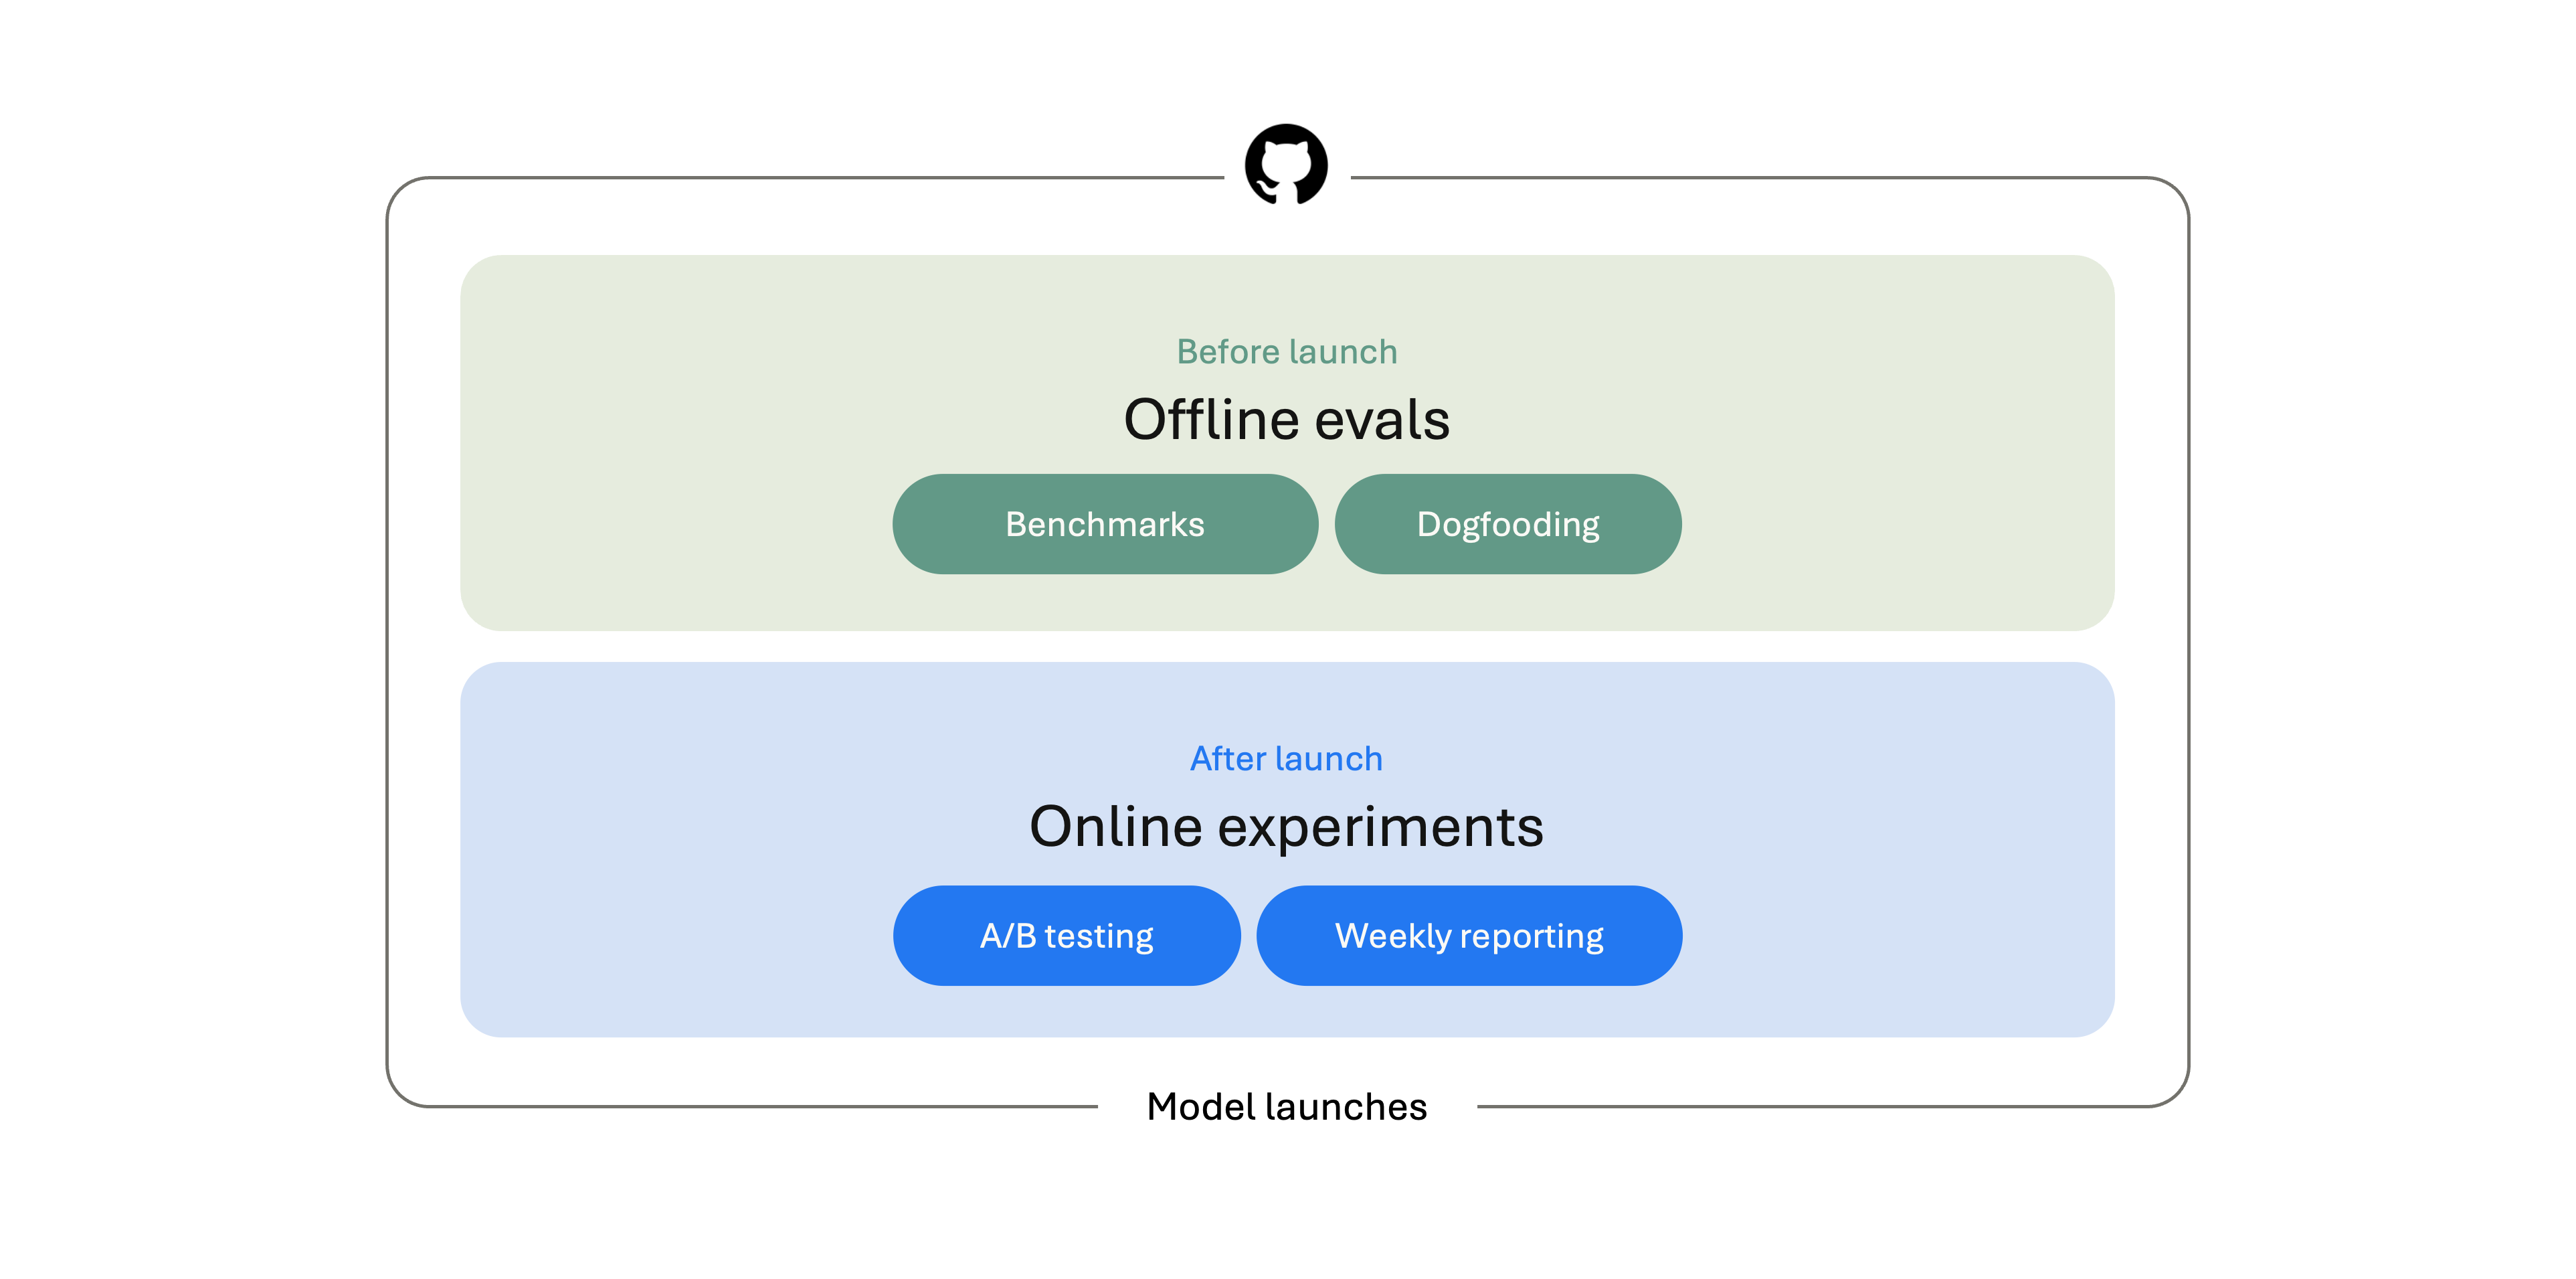
Just like you need to test a new feature before you ship it, models also need to be tested. That's where model evaluation comes in. Before a model ships in VS Code, we evaluate it from multiple angles. We run offline benchmarks, test it internally, and compare it against the models already available in the product. After the model is live, we keep measuring: A/B tests, aggregate usage signals, and weekly reporting help us understand how the model behaves in real developer workflows.
There are multiple public model benchmarks, which are useful as a shared reference point. We use these benchmarks to compare against the broader model ecosystem and to catch obvious regressions. But at frontier levels, they are no longer sufficient as a quality indicator. OpenAI stopped reporting SWE-bench Verified results after finding that frontier models could sometimes reproduce gold patches from memory, making contamination harder to ignore.
Coverage is another limitation. SWE-bench is valuable, but it is still centered on public bug-fixing tasks. Terminal-Bench is useful for measuring command-line competence, but many tasks look more like isolated terminal puzzles than the kinds of workflows developers actually bring to an editor. Real-world coding agents need to do more than patch a known bug or solve a shell challenge. They need to scaffold projects, migrate codebases, refactor across files, follow instructions, and handle terminals and browsers.
We still run these benchmarks, but they are only a starting point. To decide which models are ready to ship in VS Code, we need something closer to the product we are actually building.
Building VSC-Bench
That's why we built VSC-Bench, our offline evaluation suite for VS Code agent behavior. VSC-Bench focuses on VS Code-specific developer tasks that public benchmarks do not cover well: custom agent modes, extension workflows, MCP and tool use, terminal and browser interaction, multi-turn conversations, and multi-language coding tasks across TypeScript, Python, C++, and others.
We use VSC-Bench to measure model behavior across solution correctness, agent effort, token efficiency, and latency. The chart below focuses on resolution rate and token usage, but before a model becomes part of the VS Code experience, we evaluate the full set of dimensions. That trade-off matters before a model or reasoning setting becomes a default in the editor.
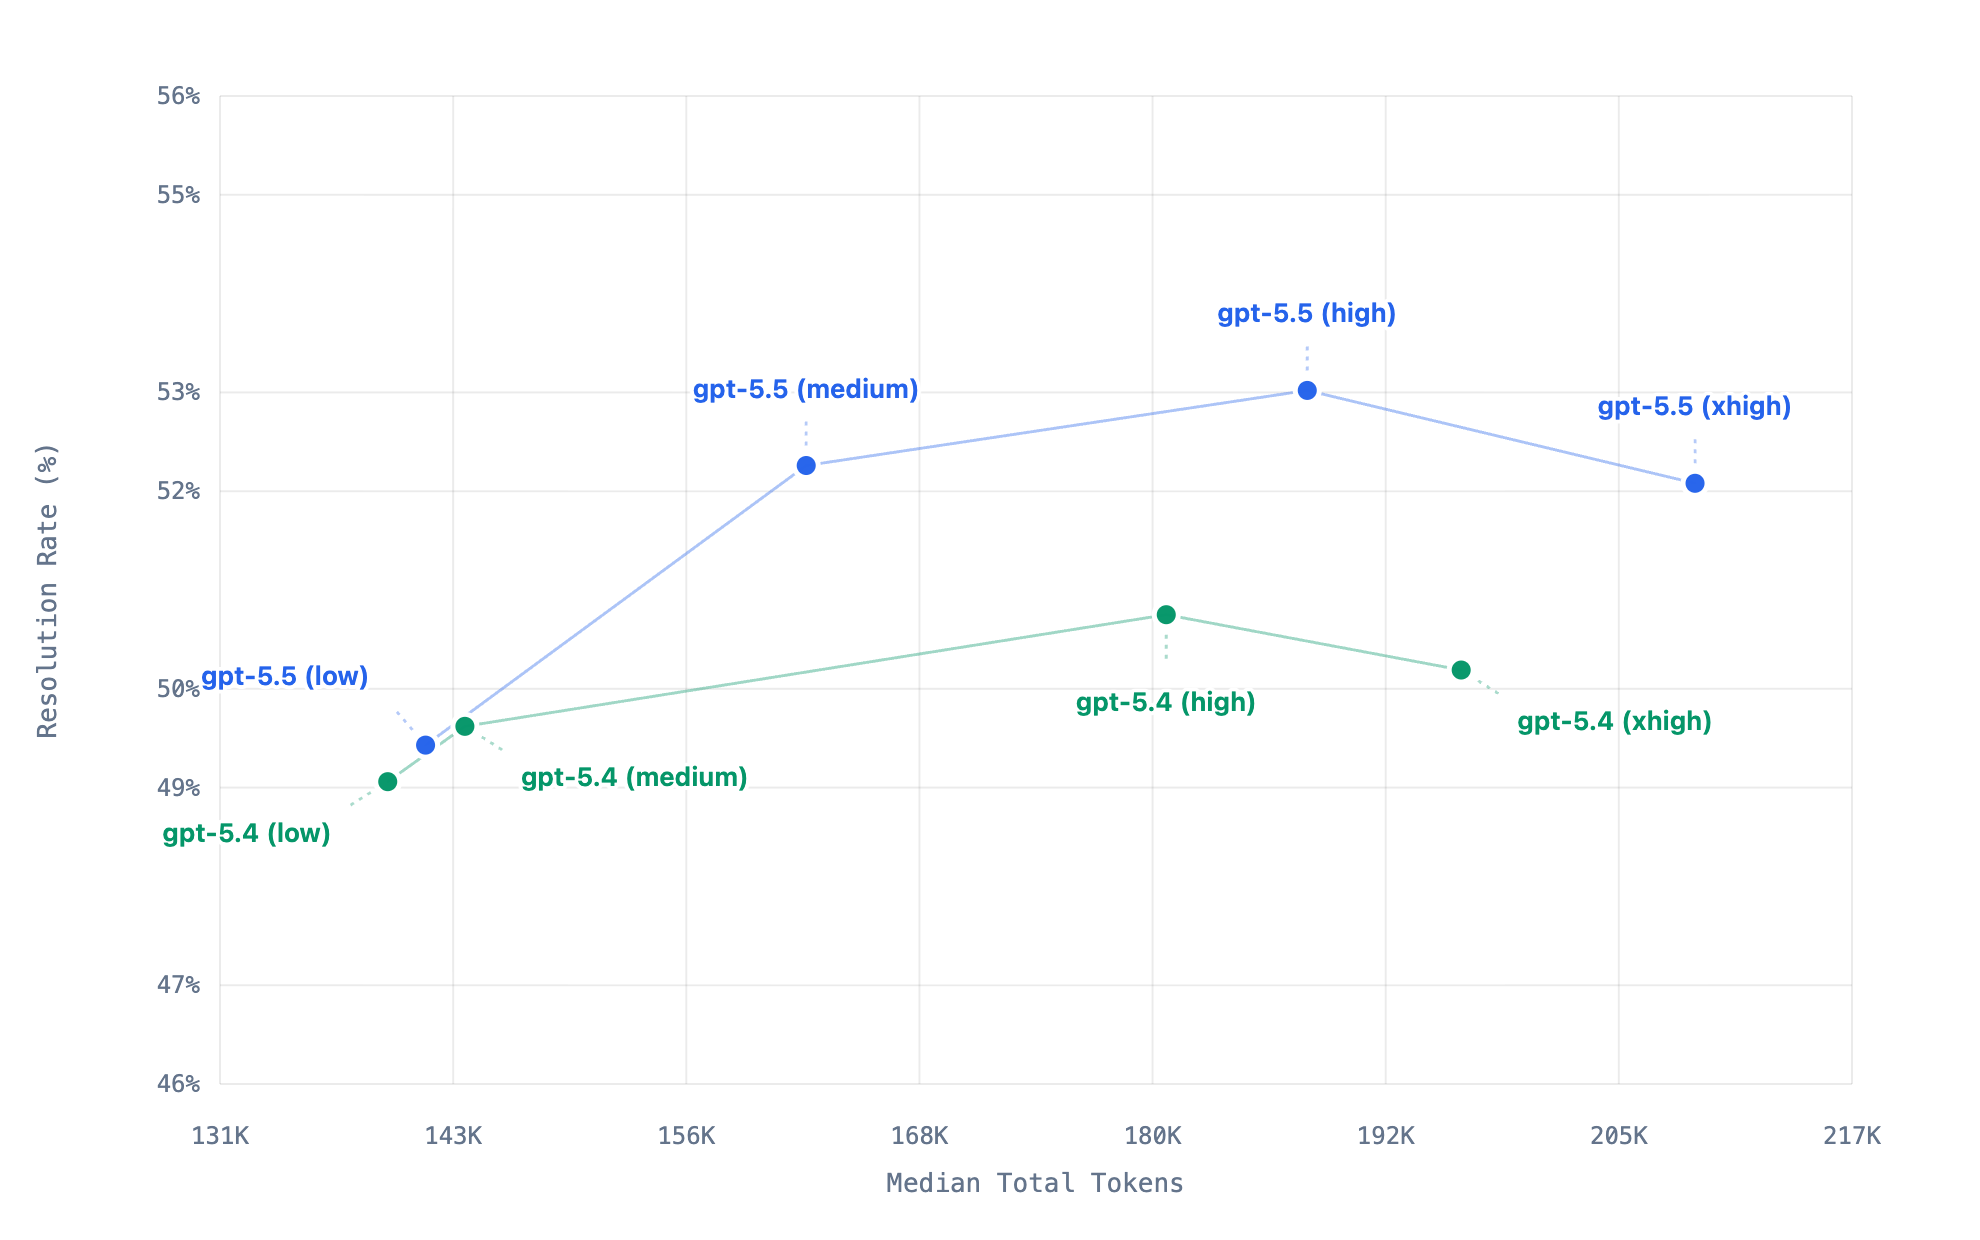 This chart summarizes 40 VSC-Bench runs across eight model-effort configurations. Each point represents one model-effort configuration, with higher points resolving more tasks and points farther to the right using more tokens. For these set of VSC-benchmark tasks, xhigh uses more tokens than high but resolves slightly fewer, which may indicate that it is past the useful effort sweet spot where extra thinking no longer converts into better outcomes.
Each VSC-Bench task runs in a reproducible, containerized workspace. The harness launches VS Code, opens the workspace, sends one or more user prompts to the agent, lets the agent respond with text and tool calls, and then evaluates what happened. That gives us a more realistic view of the full agent loop: not just whether the final code looks right, but whether the agent used the editor, terminal, language services, browser, and tools in ways that match the VS Code experience.
Together with public benchmarks, VSC-Bench gives us a more balanced signal: public evals tell us how a model compares to the field, while product-specific evals tell us whether it is ready for the experience developers expect inside VS Code.
How we benchmark agent changes before they merge
Benchmarks aren't just for shipping models. They're also how we vet harness changes before they land. If a PR touches a core tool, a system prompt, or anything else that could move agent behavior, we want benchmark numbers before it merges.
For those PRs, the VS Code team uses an automated eval assessment flow. Adding the ~requires-eval-assessment label to a PR kicks off the process: the PR is built, shipped as an eval agent, benchmarked, and the results are posted back on the PR:
-
Build the PR. A webhook routes the label event into a workflow in
vscode-engineering, which kicks off an Azure DevOps build against the PR's merge ref. One automatic retry on failure; the PR gets a "queued 1 of 2" comment so reviewers can follow along. -
Publish an eval agent. On a successful build, a publish pipeline ships a versioned agent (
0.0.0-dev.<sha>) to thevscode-evalsnpm feed on thedevtag. The PR comment flips to "queued 2 of 2". -
File an evald issue. The publish pipeline fires a
repository_dispatchback atvscode-engineering, which opens a model-evaluation issue ongithub/evaldpinned to that exact published agent. -
Report back. evald runs the benchmark, monitors it, and produces an analysis comment. An Azure Logic App forwards just the comment URLs (not the analysis body — that stays private on evald) back as another
repository_dispatch, which posts a link on the original VS Code PR.
The model is the engine. The harness is the car.
We started with a question developers ask every few months: which model is best? But for a coding agent, that question is a little like asking: which engine is best? The engine matters, but it's not enough on its own. It's the context the model sees, the tools it can reach, the loop that keeps it going, and the evaluation that makes sure it all works. That's the harness, and it's what we spend most of our engineering time on.
As models gain new capabilities like longer context, better planning, and native tool use, the harness evolves to take advantage of them. And as developers push agent mode into new workflows, we feed what we learn back into the loop, the tools, and the evaluations. Every VS Code release ships harness improvements alongside model updates.
If you're curious about how the harness works, you can get hands-on with it today. Explore the VS Code source code, use the Tools UI in Chat to see which tools are available for a request, and open the Chat Debug View to inspect the prompts, tool calls, and results behind an agent run. Try switching models, add your own tools, and let us know what works — share your feedback in our GitHub repo.
Happy coding! 💙