September 2023 (version 1.83)
Update 1.83.1: The update addresses these issues.
Downloads: Windows: x64 Arm64 | Mac: Universal Intel silicon | Linux: deb rpm tarball Arm snap
Welcome to the September 2023 release of Visual Studio Code. There are many updates in this version that we hope you'll like, some of the key highlights include:
- Accessibility improvements - Screen reader support for the pull request comments.
- Better Command Palette search - New "similar commands" list to help command discovery.
- Add custom icons to profiles - Display an icon to easily identify the active profile.
- Compact editor tab height - Shrinks editor tab height for larger editor region.
- Dedicated pinned editor row - New editor tab row supports pin/unpin via drag and drop.
- Go to Symbol in notebooks - Quickly navigate to code symbols in your notebook.
- Python debugger updates - Configure whether to step into system/library or just your code.
- Preview: GitHub Copilot - Test generation based on current framework and project conventions.
If you'd like to read these release notes online, go to Updates on code.visualstudio.com.
Insiders: Want to try new features as soon as possible? You can download the nightly Insiders build and try the latest updates as soon as they are available.
Accessibility
GitHub Pull Requests and Issues Comment improvements
The GitHub Pull Requests and Issues extension, which allows you to work on, create, and manage pull requests and issues, has seen many accessibility improvements this iteration for the commenting and reviewing experience.
A screen reader user is informed when they open an editor if it contains commenting ranges. A new accessibility help dialog (editor.action.accessibilityHelp) provides insight into commands for navigation between comment threads and ranges.
Additionally, the Comment control is now accessible. A help dialog (editor.action.accessibilityHelp) is also available in that context to inform a user of what to expect and how to utilize the feature. There are also new commands Comments: Go to Next Commenting Range (⌘K ⌥⌘↓ (Windows, Linux Ctrl+K Ctrl+Alt+Down)) and Comments: Go to Previous Commenting Range (⌘K ⌥⌘↑ (Windows, Linux Ctrl+K Ctrl+Alt+Up)) for navigation between commenting ranges.
Workbench
Similar command results in the Command Palette
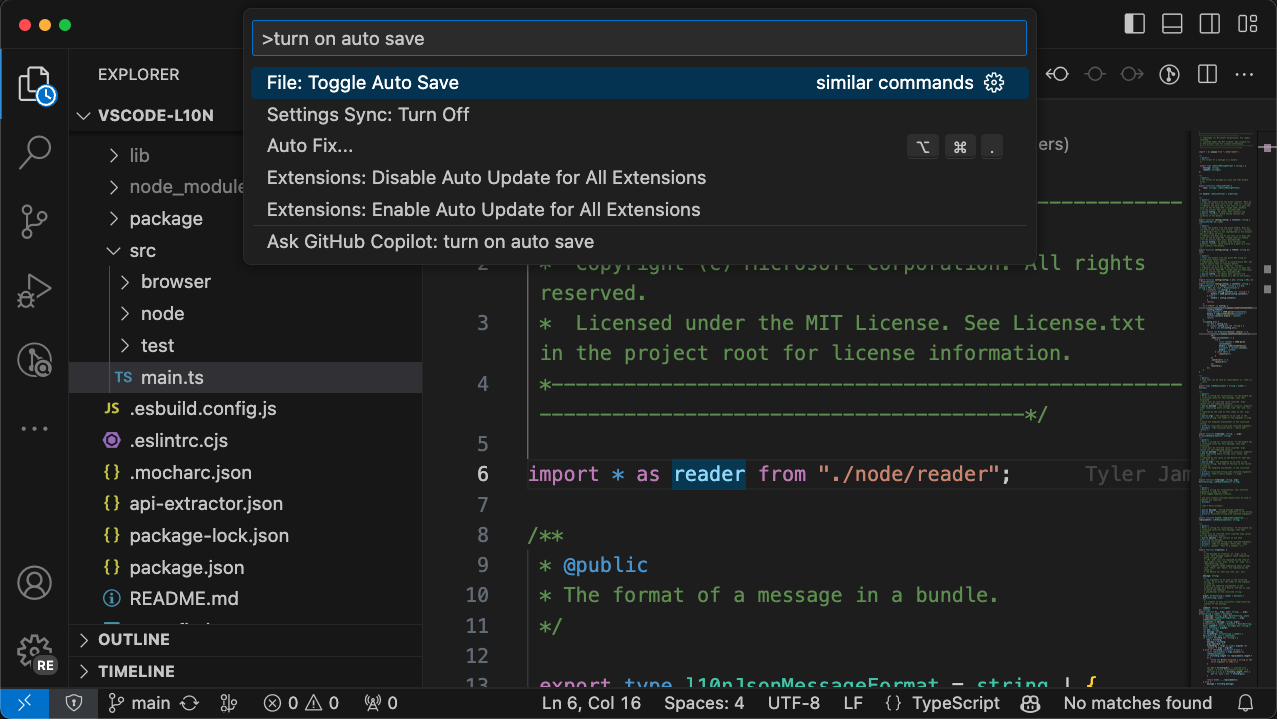
Finding the command you're looking for can be challenging. In VS Code alone there are over 2000 commands... and with your favorite extensions, that number can soar even higher. We wanted to introduce a way to help you find what you're looking for while still keeping the speed that the Command Palette offers today. To do this, we are including a new section in the Command Palette results called "similar commands". Here are some examples:
A query no longer has to "fuzzily" match to show up in the results. Like "Toggle Auto Save":
If there are fuzzy results, those still show up at the top and similar commands follow:
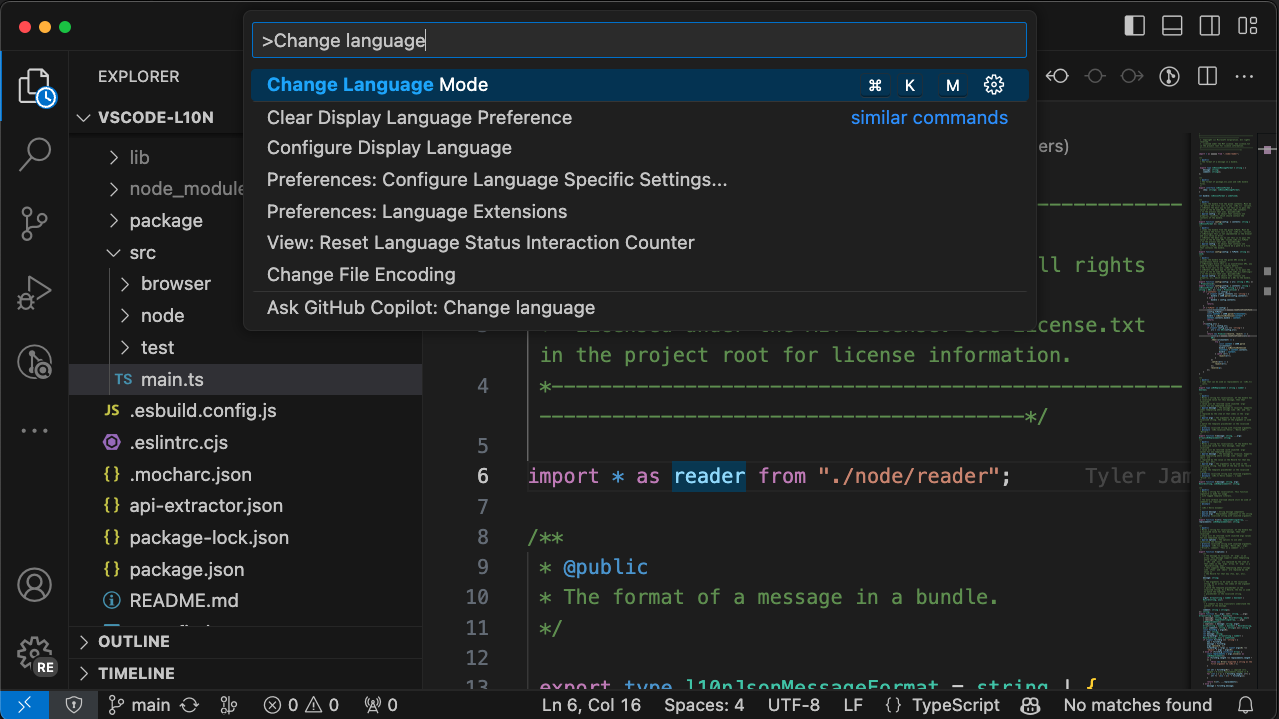
Extension contributed commands also get picked up:
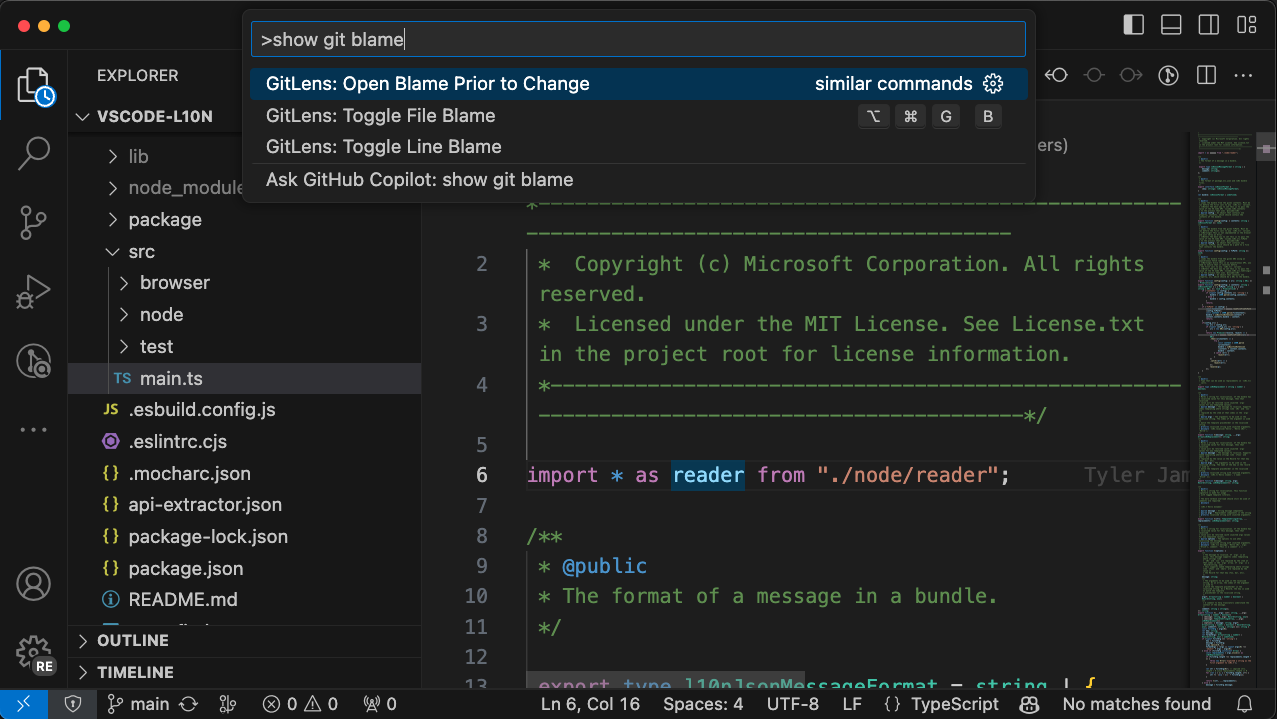
We think that this will really help those who struggle to remember the exact command name... let's be honest, that's pretty much all of us at some point.
This is just the first cut of this new feature and still requires matching exact words in command names. In the future, you can expect improvements such as:
- Commands matching based on the non-visible description of the command.
- Better basic handling of synonyms ("toggle" and "turn on/off", "show" and "reveal", etc.)
Let us know what you think!
Icons for profiles
You can now associate an icon with a profile. This icon will be shown in the Activity Bar in the place of the Manage gear icon. This is useful if you have multiple profiles and want to quickly identify which profile is currently active.
The following picture shows the icon selection dialog while creating a new profile.
![]()
The active profile icon is then shown in the Activity Bar.
![]()
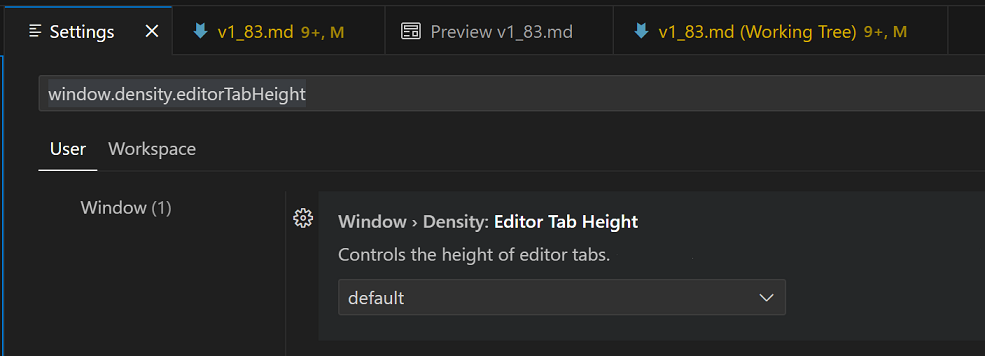
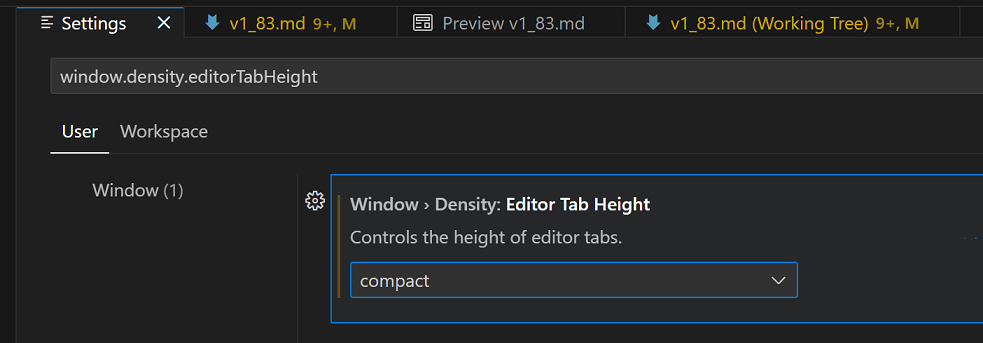
Editor tab height density
The window.density.editorTabHeight setting allows users to reduce the tab height to a more compact size.
Default editor tab height
Compact editor tab height
Pinned editor tabs on separate row
A new setting workbench.editor.pinnedTabsOnSeparateRow has been added. When activated, pinned tabs are displayed on a separate row above the other tabs. The editor tabs automatically pin or unpin when dragged between the tab rows.
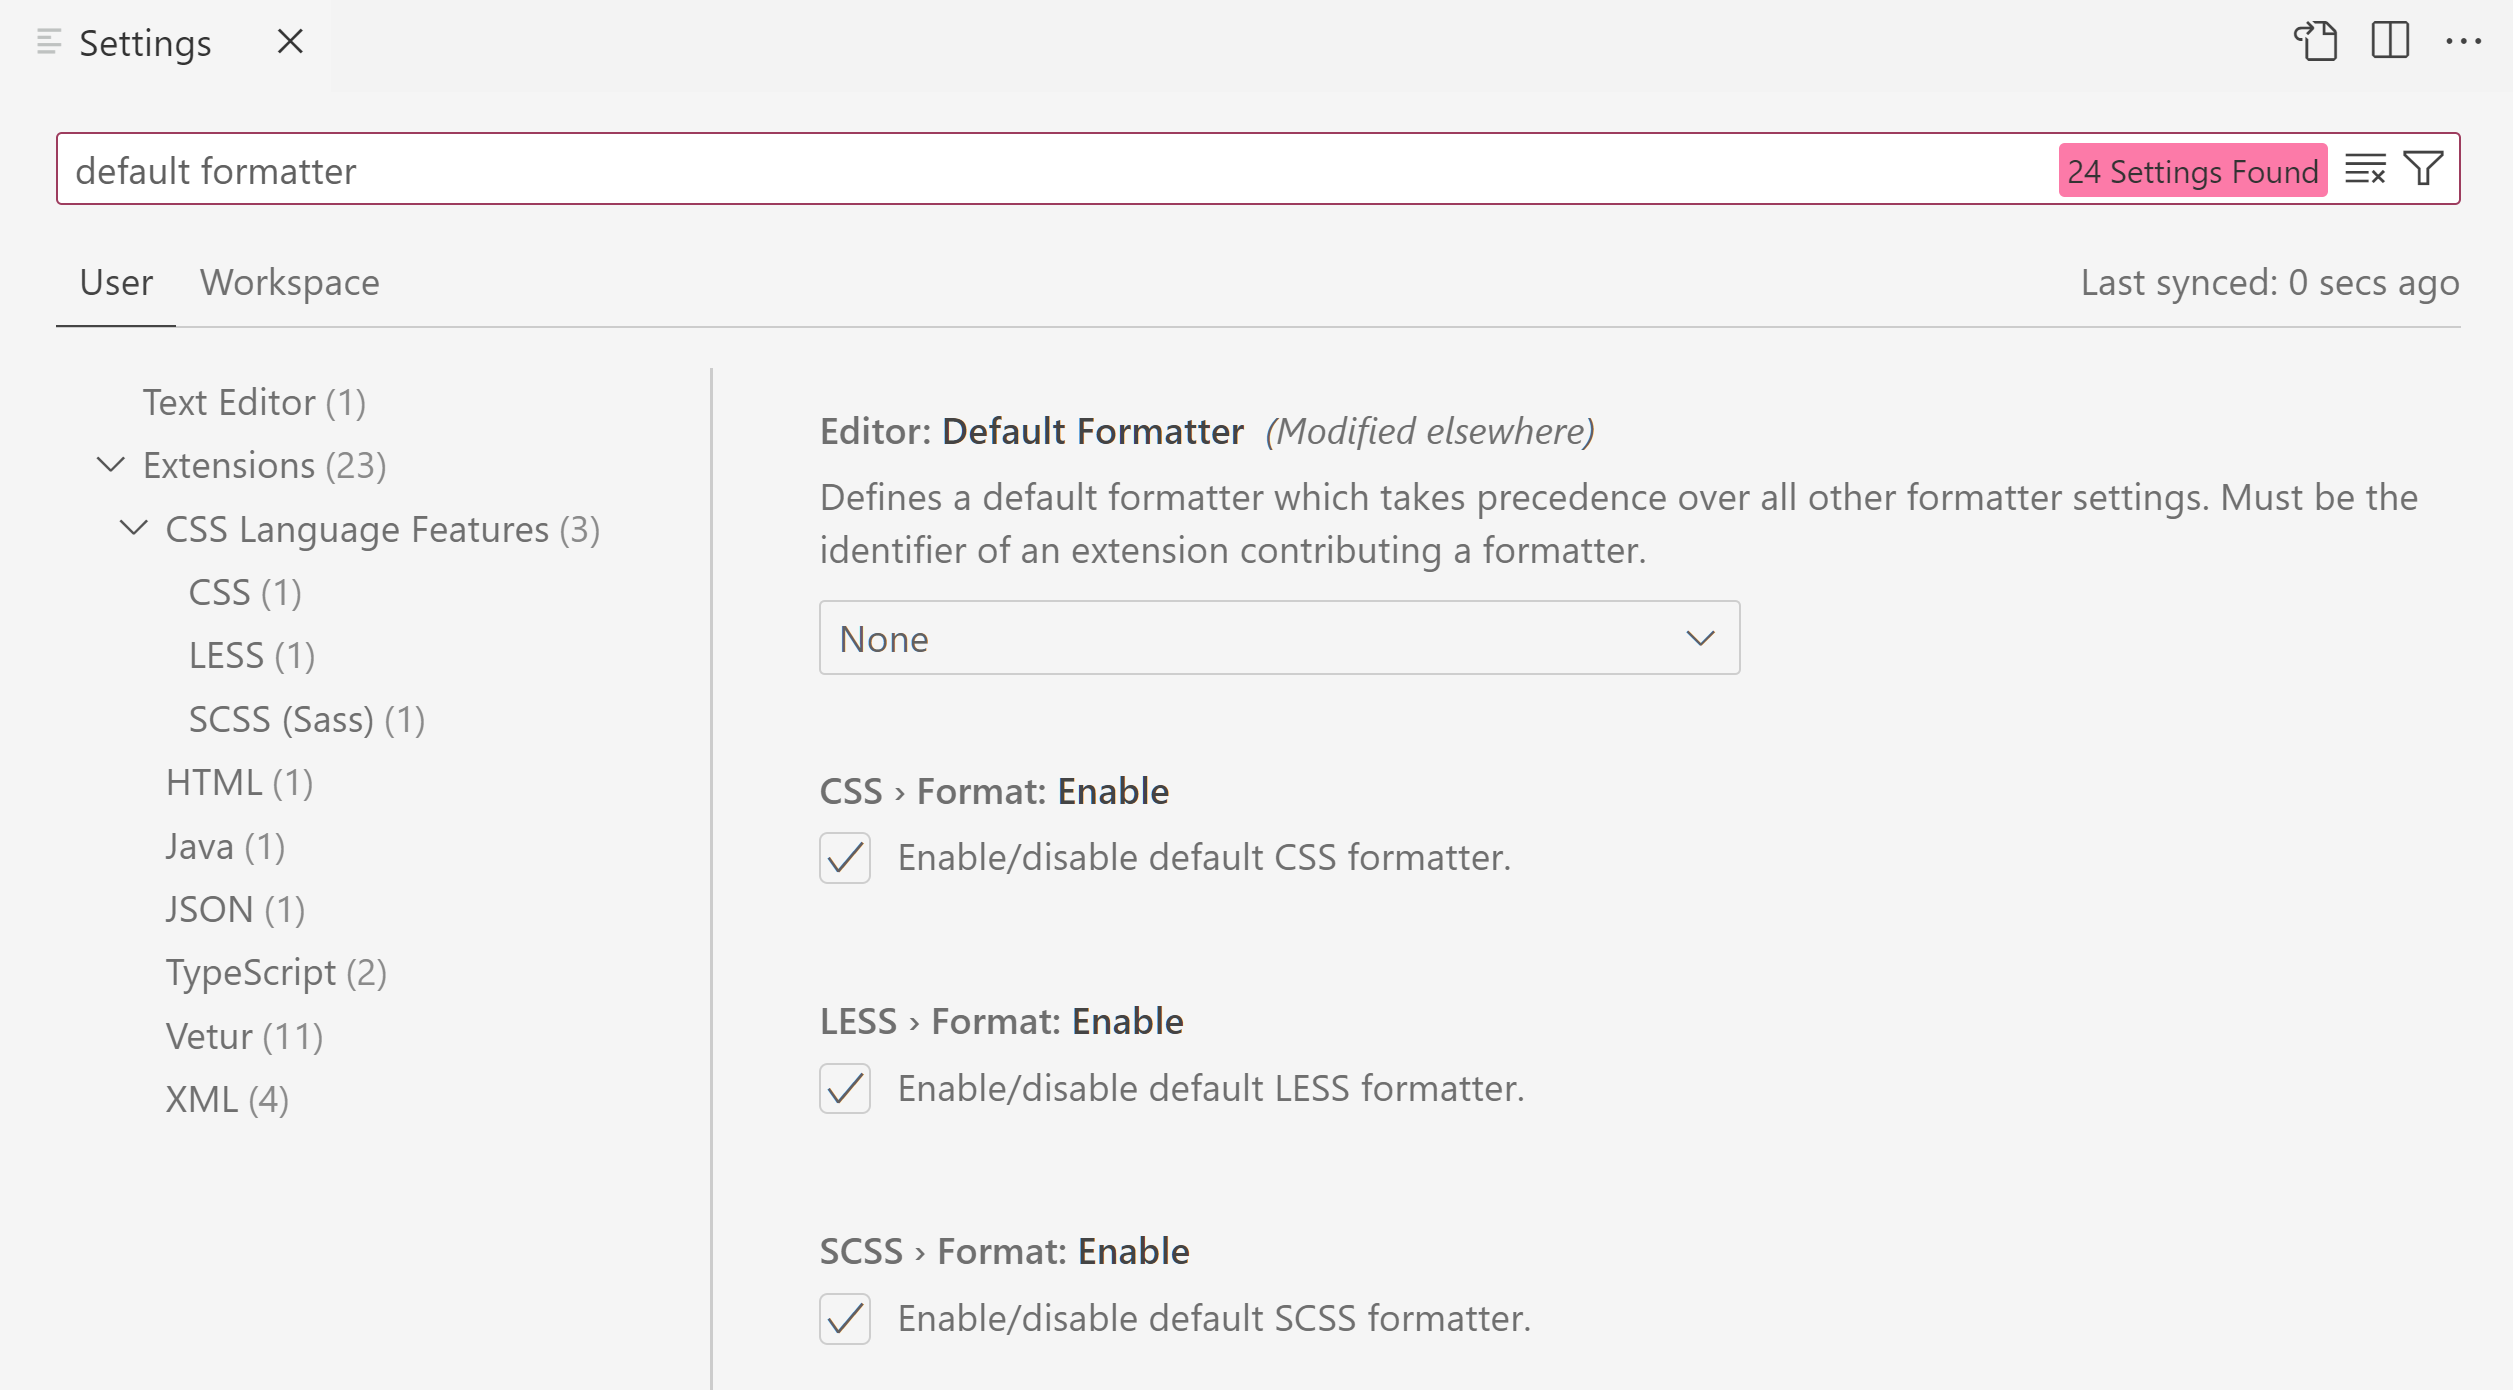
Settings editor search adjustments
The Settings editor now shows fewer results for a given search query to reduce noise. If you have the GitHub Copilot Chat extension installed, in addition to settings found by keyword matches, only the top five Copilot Chat setting matches are chosen, rather than the top fifteen.
The search results are now also ordered by the Settings editor table of contents to show commonly used settings at the top, and to show filtered extension settings in their original order. To revert to ordering the search results by match type and score, set the workbench.settings.settingsSearchTocBehavior setting to "hide", clear the search query, and start another search.
Theme: Light Pink (preview on vscode.dev)
Improved overflow behavior for editor actions
When the number of editor actions exceeds the available space, the actions overflow into the ... More Actions menu. This logic has been refined and some vital actions, like Close or Split Editor, are now excepted. This means that they will always be visible, even if the available space is limited.
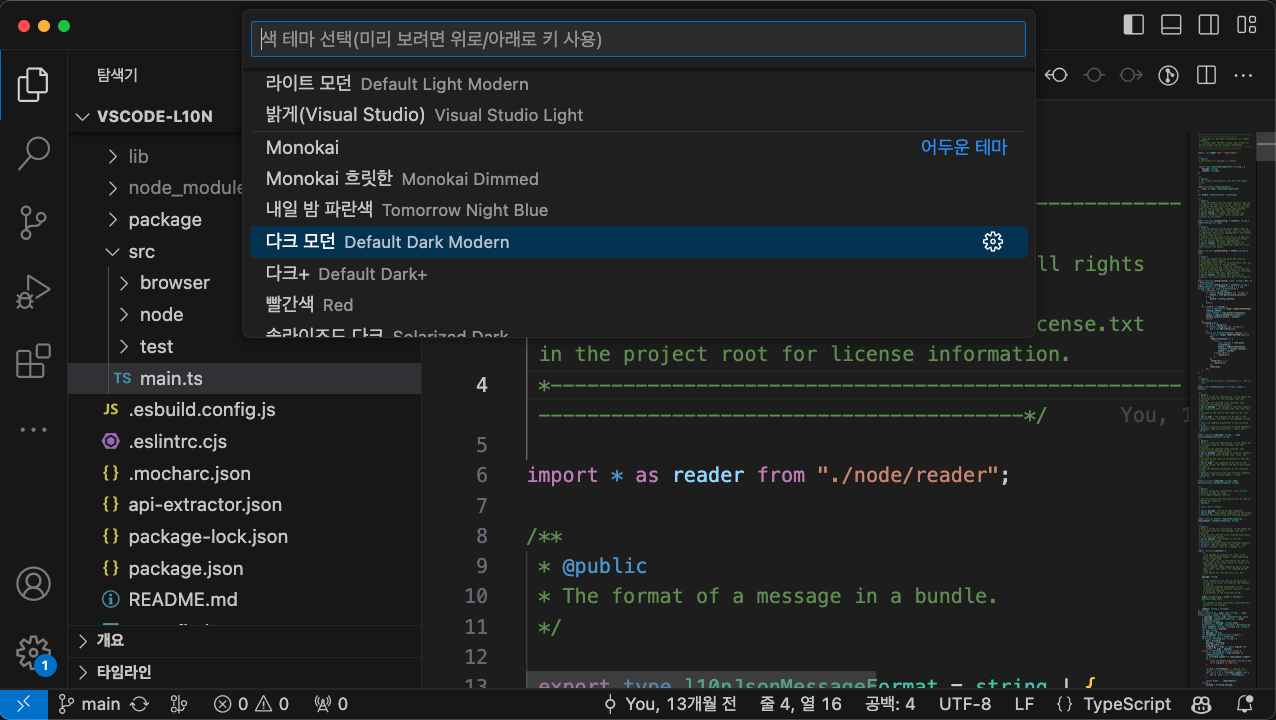
Color Theme picker now shows theme identifier
The Color Theme picker now shows the localized name of the color theme and its string identifier next to it. This was done to help users who use a non-English language pack but only know the English name of the theme.
Comments
The Comments editor is used in extensions such as the GitHub Pull Request and Issues extension, where it displays pull request comments.
Comment editor size
The Comment editor now expands as lines are added, up to a maximum height dependent on the size of the editor that the comment is in.
Open Comments view on unresolved comments
The setting comments.openView has a new possible value firstFileUnresolved. Setting firstFileUnresolved causes the Comments view to open the first time per session that a file with unresolved comments is opened.
Automatically collapse resolved comments
By default, when you resolve a comment thread, it will now collapse. This feature can be disabled with the setting "comments.collapseOnResolve".
Editor
Code Actions on Save and Auto Save
You can now enable Code Actions on Auto Save in the editor. This triggers Code Actions when you save or Auto Save with window change (onWindowChange) or focus change (onFocusChange). To enable this feature or update your current settings, check Editor: Code Actions On Save (editor.codeActionsOnSave) and change each Code Action's setting to always.
The setting values were also updated, with the current boolean values to be deprecated in favor of the string equivalent.
The options are:
explicit: Triggers Code Actions when explicitly saved. Same astrue.always: Triggers Code Actions when explicitly saved and on Auto Saves from window or focus changes.never: Never triggers Code Actions on save. Same asfalse.
Boolean values are still supported in this release.
Notebooks
Go to Symbol in notebooks
With the notebook.gotoSymbols.showAllSymbols enabled, the Go to Symbol Quick Pick is populated with all code symbols in the notebook.
Scrolling on cell execution
You can now configure how much of the next cell is revealed when running notebook.cell.executeAndSelectBelow with Shift+Enter with the notebook.scrolling.revealNextCellOnExecute setting:
fullCell- The full next cell (default).firstLine- Just the first line.none- Don't scroll at all.
"notebook.scrolling.revealNextCellOnExecute": "firstLine" is shown below.
Whitespace trimming support
Notebooks now respect the existing three whitespace-related settings:
files.trimTrailingWhitespace- Trim trailing whitespace when saving a file.files.trimFinalNewlines- Trim all newlines after the final newline in a file.files.insertFinalNewline- Automatically insert a final newline at the end of a file.
These settings are applied on save, including Auto Save.
Finalized notebook Code Action API
Notebooks now fully support contributed Code Actions, and have a dedicated Code Action Kind to support them. If an extension author defines an action with a kind prefixed notebook.source., on Save, the notebook editor runs that provided action against the entire notebook, rather than every cell individually. To edit the Code Actions that will run on save, you can set Notebook: Code Actions on Save in the Settings editor or edit "notebook.codeActionsOnSave" in your settings.json file.
The current enablements for Code Actions were updated, with the previous boolean values deprecated in favor of enumeration equivalents. The options are:
"explicit": Triggers Code Actions when explicitly saved. Same astrue."never": Never triggers Code Actions on save. Same asfalse.
A third option "always" is coming soon to fully match editor Code Actions, letting users trigger notebook Code Actions upon Auto Save settings onFocusChange and onWindowChange.
Languages
Perl 6/Raku
The Perl 6 language has been renamed to Raku (language identifier raku), and Raku will be automatically selected as the language for .raku files.
Debug
JavaScript Debugger
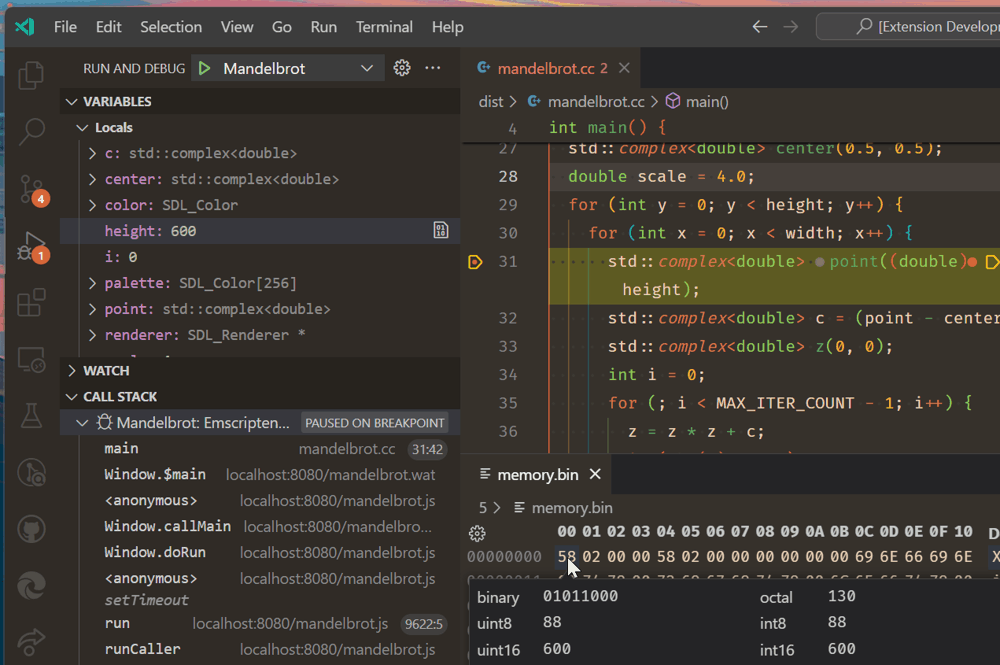
WebAssembly debugging
The JavaScript debugger can now debug code compiled into WebAssembly if it includes DWARF debug information. For example, C++ code compiled using Emscripten can be debugged:
Theme: Codesong (preview on vscode.dev)
To enable this, you'll want to install the WebAssembly DWARF Debugging extension, which plugs in to the built-in JavaScript debugger. Read more about this in Debugging WebAssembly.
WebAssembly debugging is built upon the C/C++ Debugging Extension from the Chromium authors, and was made possible with their support.
Improved Call Stack view
Methods and functions in the Call Stack view will now include the name of function (this) context. For example, a call stack for method bar on class Foo is now displayed as Foo.bar.
Remote Development
The Remote Development extensions, allow you to use a Dev Container, remote machine via SSH or Remote Tunnels, or the Windows Subsystem for Linux (WSL) as a full-featured development environment.
This release adds the ability to connect to Dev Containers using Tunnels similar to over SSH. You can learn more about this new feature in the Remote Development release notes.
Contributions to extensions
GitHub Copilot
Improvements to /tests
We have improved /tests for the Chat view and inline chat available with the GitHub Copilot Chat extension. The /test slash command is now better at detecting the testing framework you are using and will generate new tests in the same style. Also, it should be much better with suggesting names for new test files, like test_foo.py for foo.py and bar.test.js for bar.js.
Inline chat goes multi-turn
Inline chat now keeps all prompts of the current session, which allows you to refer to previous messages and to reply to questions.
In the short video below, inline chat remembers that the user has said they are based in Tokyo, when providing a code snippet to calculate the local time and time difference to Zurich.
Ask GitHub Copilot defaults to the Chat view
A few months ago, we introduced an Ask GitHub Copilot option in the Command Palette so that you can take your query in the Command Palette and open it in a Copilot chat if the Command Palette didn't provide a useful answer.
We gathered feedback on the preferred experience Ask GitHub Copilot should open: the Chat view in the side bar or Quick Chat. In an effort to make the first time experience more familiar, we chose the Chat view.
With that said, if you would like Ask GitHub Copilot to open in Quick Chat, you can change the behavior with the askChatLocation setting:
"workbench.commandPalette.experimental.askChatLocation": "quickChat"
Command Palette similar commands
This iteration, we shipped the similar commands feature in the Command Palette. Copilot Chat users get an even better similar commands experience because we can use Copilot AI to determine similarity. These smarts help with synonyms and intent, and in our testing, Copilot was able to handle similarity across spoken languages as well. Finding the exact command you're looking for in the Command Palette has never been easier!
Jupyter
Finalized Jupyter Server Provider API for extension authors
The Jupyter extension's API for contributing Jupyter Servers has been finalized. Extensions can use the API to provide a list of custom Jupyter Servers to display in the Kernel Picker.
Examples of API usage can be found in the Jupyter Server Provider Sample. The JupyterHub extension also makes use of this same API.
The npm package @vscode/jupyter-extension contains all of the TypeScript type definitions.
JupyterHub extension
There is now a JupyterHub extension that supports logging into JupyterHub and executing code against kernels from within a notebook or Interactive Window in VS Code. This extension also works in the browser in vscode.dev and github.dev.
If you have any issues with this new extension or wish to provide feedback, you can file an issue in the JupyterHub extension GitHub repo.
Python
Python Debugger updates
The Debugpy extension, which was announced a few months ago, has been renamed to Python Debugger for improved discoverability in the Marketplace.
This extension now includes a new User setting debugpy.debugJustMyCode that when disabled, it allows you to step into system or third-party library code for all your applications (by default, the debugger steps only into the code that is defined in your own Python code). This was a popular feature request for those who wanted to more conveniently disable justMyCode to all of their projects, instead of having to manually configure it in all of their projects' launch.json debug configurations.
To try it out, make sure you have the Python Debugger extension installed. Then open the Settings editor (⌘, (Windows, Linux Ctrl+,)), search for "debugJustMyCode", and disable the checkbox:
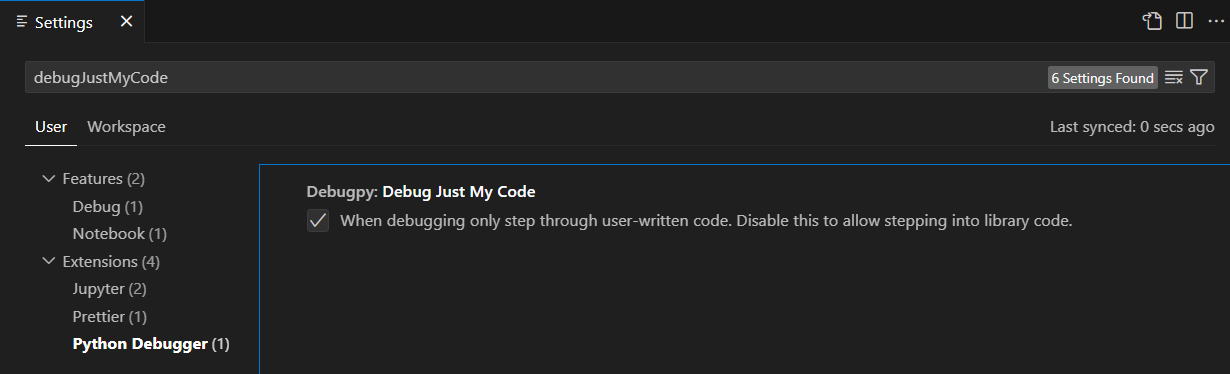
Now once you create a launch.json file, the extension uses the value of debugpy.debugJustMyCode by default, as long as justMyCode is not specified in the file. Note that when justMyCode is specified in launch.json, its value takes precedence over the debugpy.debugJustMyCode setting.
Lint on change option for Pylint extension
By default, the Pylint extension only reports errors and warnings when a file is saved. There's now a new setting called pylint.lintOnChange that if set to true, instructs the extension to report errors and warnings as you type, without having to save the file.
Mypy extension reporting scope and daemon mode
The Mypy Type Checker extension has now two new settings to allow you to specify Mypy's reporting scope and whether to use Mypy's daemon.
The first is mypy-type-checker.reportingScope, which can be set to file (the default) to enable problems to be reported only for open files in the workspace, or workspace to enable reporting for all files in the workspace.
The second is mypy-type-checker.preferDaemon, which when set to true, uses Mypy's daemon (dmypy) instead of Mypy itself (mypy) to perform type checking, which can be much faster in some scenarios.
Update on call argument inlay hints setting
Previously, Pylance's setting to enable inlay hints for partial call arguments (python.analysis.inlayHints.callArgumentNames) could only be set to true or false to enable or disable type hints for call arguments. This setting has been modified to allow more granular control over the type hints that are shown for call arguments.
It can now be set to partial to disable hints for positional-only and keyword-only parameters, all to enable them, or off to disable them completely.
Deprecation of Python 3.7 support
As previously mentioned in our July 2023 release blog, we have dropped official Python 3.7 support in the Python extension. There are no plans to actively remove support for Python 3.7, and so we expect the extension will continue to work unofficially with Python 3.7 for the foreseeable future.
Keep in mind, that all other releases of Python are now on an annual release cadence, thus, we expect to stop official support for a Python release once it reaches EOL in the first extension release of the following calendar year (for example, Python 3.8 is scheduled to reach EOL in October 2024, so the first extension release in 2025 will stop official support).
GitHub Pull Requests and Issues
There has been more progress on the GitHub Pull Requests and Issues extension, which allows you to work on, create, and manage pull requests and issues.
- Accessibility for reviewing PRs has been improved.
- Commits are shown in the Create view even when the branch hasn't been published.
Review the changelog for the 0.74.0 release of the extension to learn about the other highlights.
Preview Features
Nearest Quick Fix keyboard shortcut
There is a new setting to activate the nearest Quick Fix in a line from ⌘. (Windows, Linux Ctrl+.) (command ID editor.action.quickFix), no matter where your cursor is in that line.
The command highlights the source code that will be refactored or fixed with Quick Fixes. Normal Code Actions and non-fix refactorings can still be activated at the cursor location. To enable this feature, check Code Action Widget: Include Nearby Quickfixes (editor.codeActionWidget.includeNearbyQuickfixes).
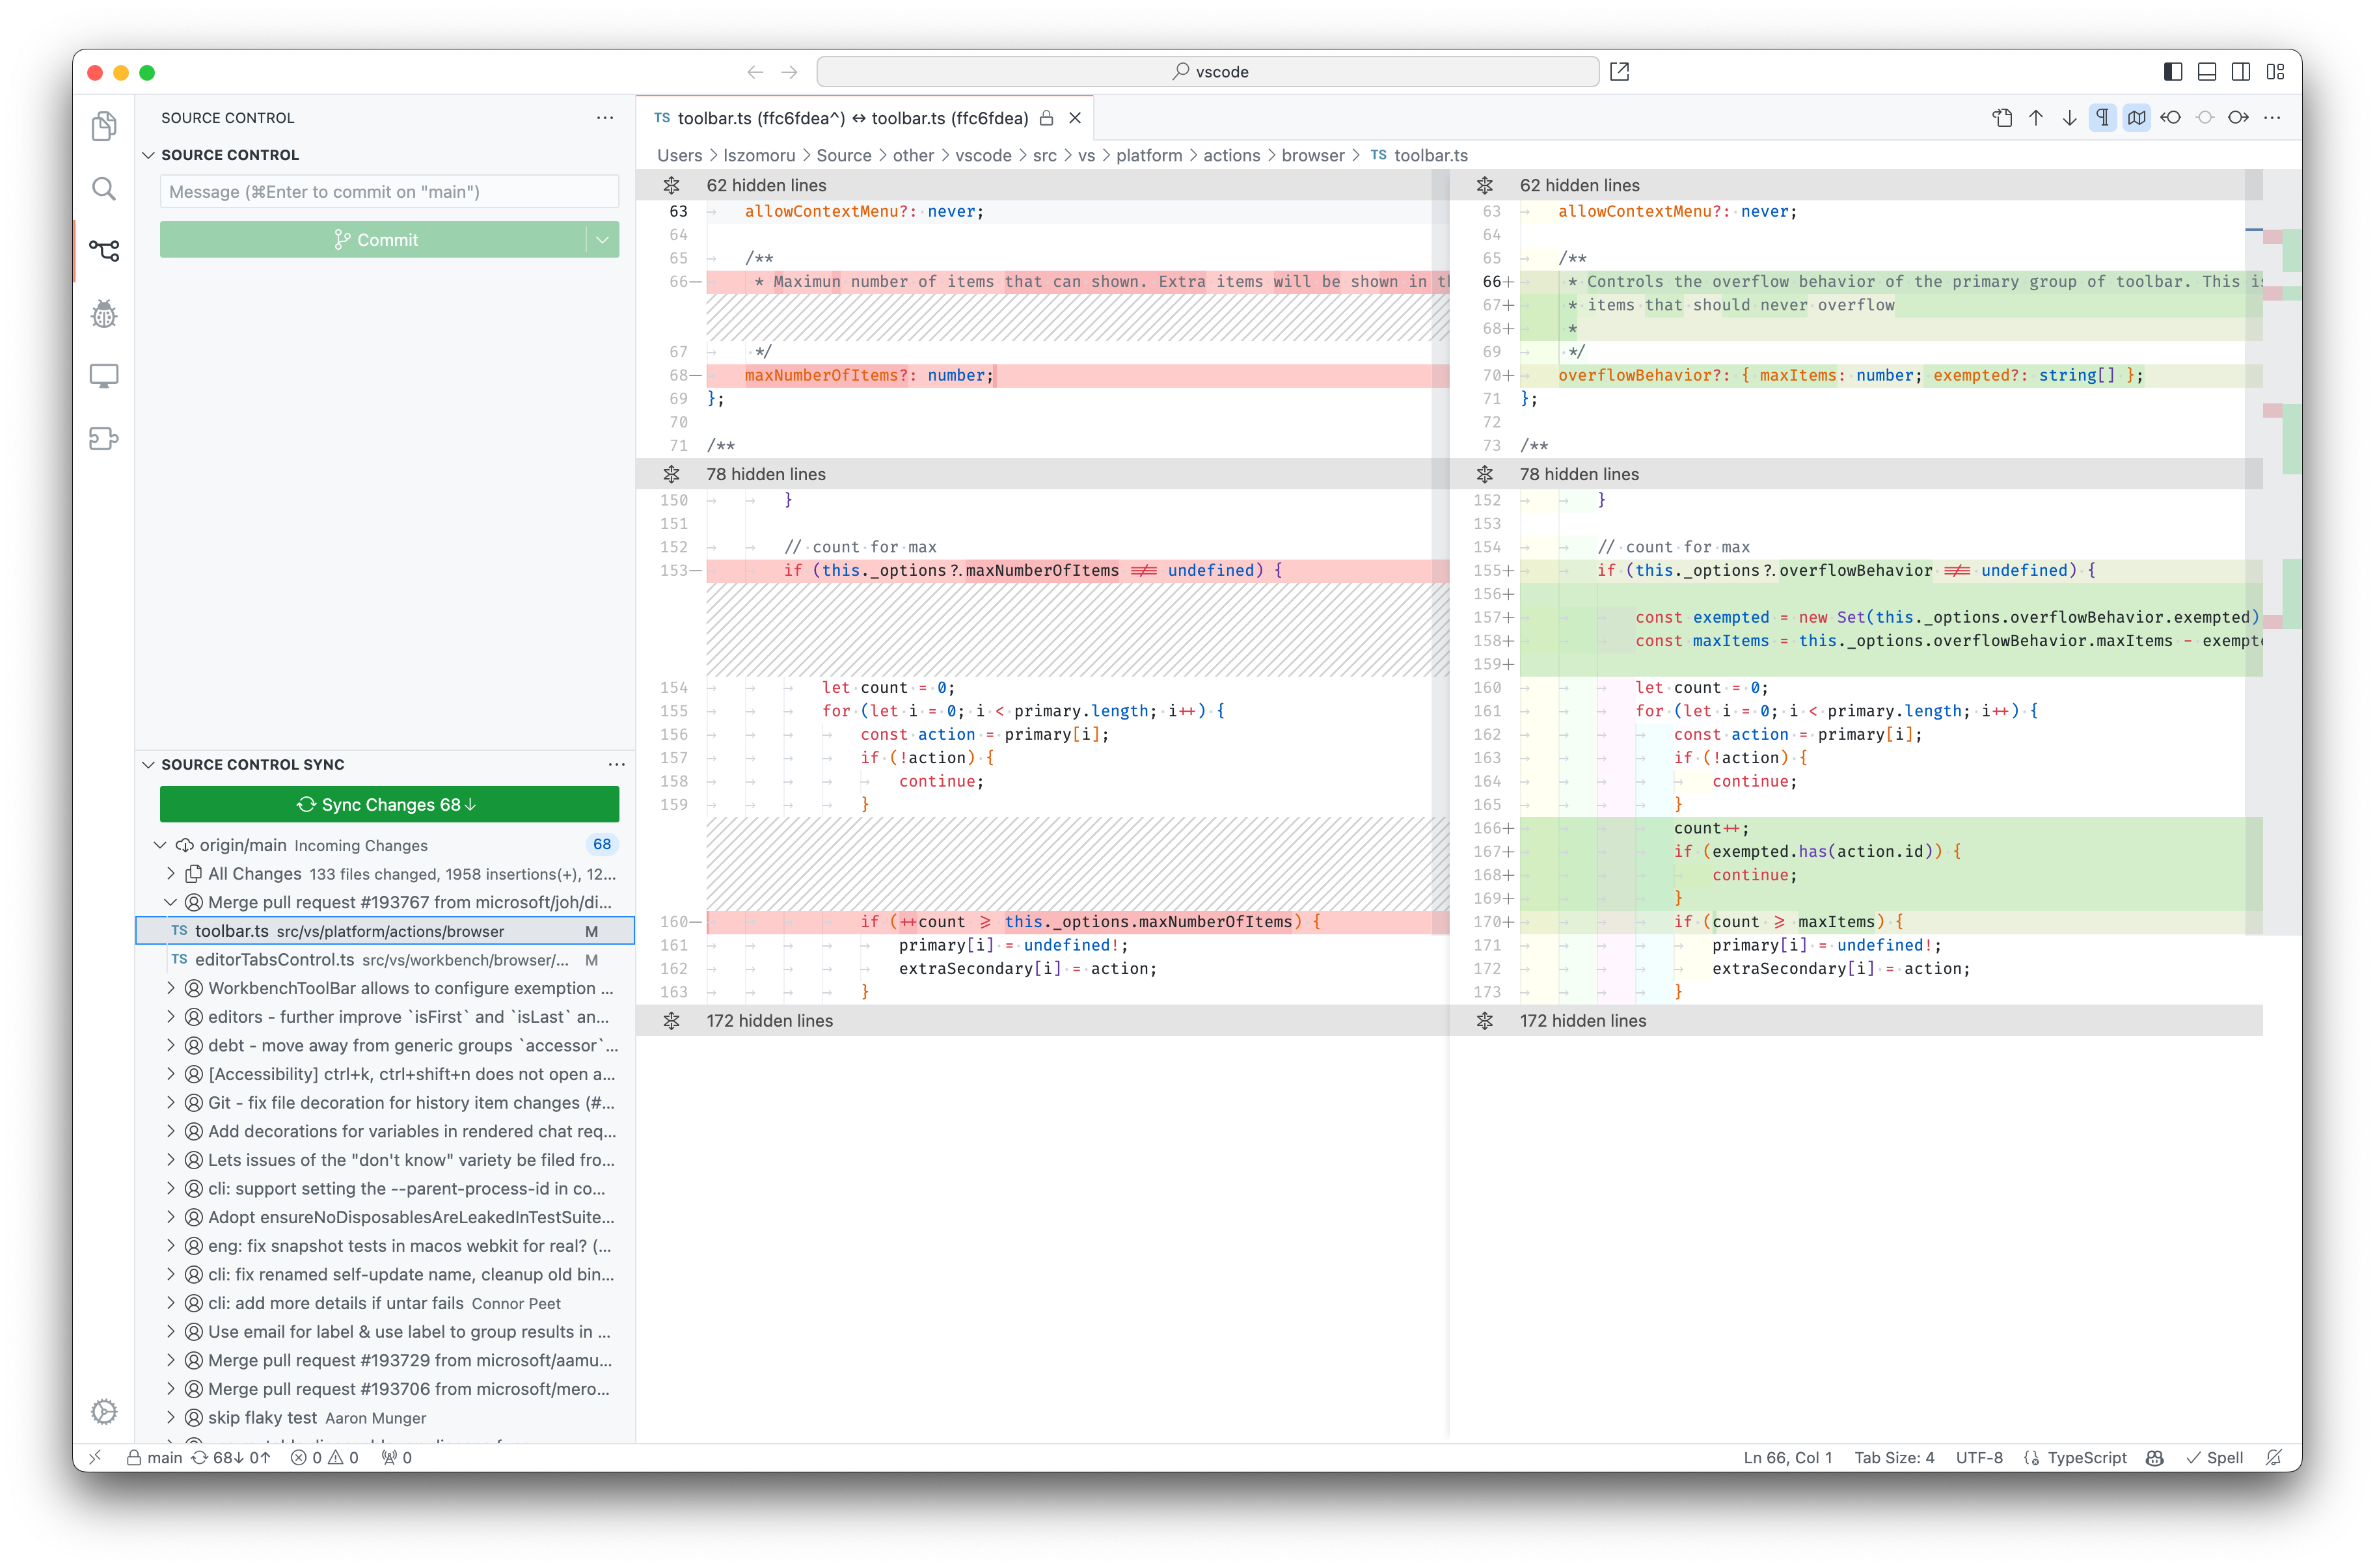
Source Control Sync view
This milestone's release contains an early version of the Source Control Sync view. The new view provides details about the local changes that have not been pushed to the remote branch (outgoing) and changes that have not been pulled down locally from the remote branch (incoming). The view also lets you publish a branch and sync changes (pull/push) with a remote branch. The new view is still experimental and we will continue to improve it in the coming milestones based on user feedback. You can display the new view via the scm.experimental.showSyncView setting. Please try it out and provide feedback in issue #192290.
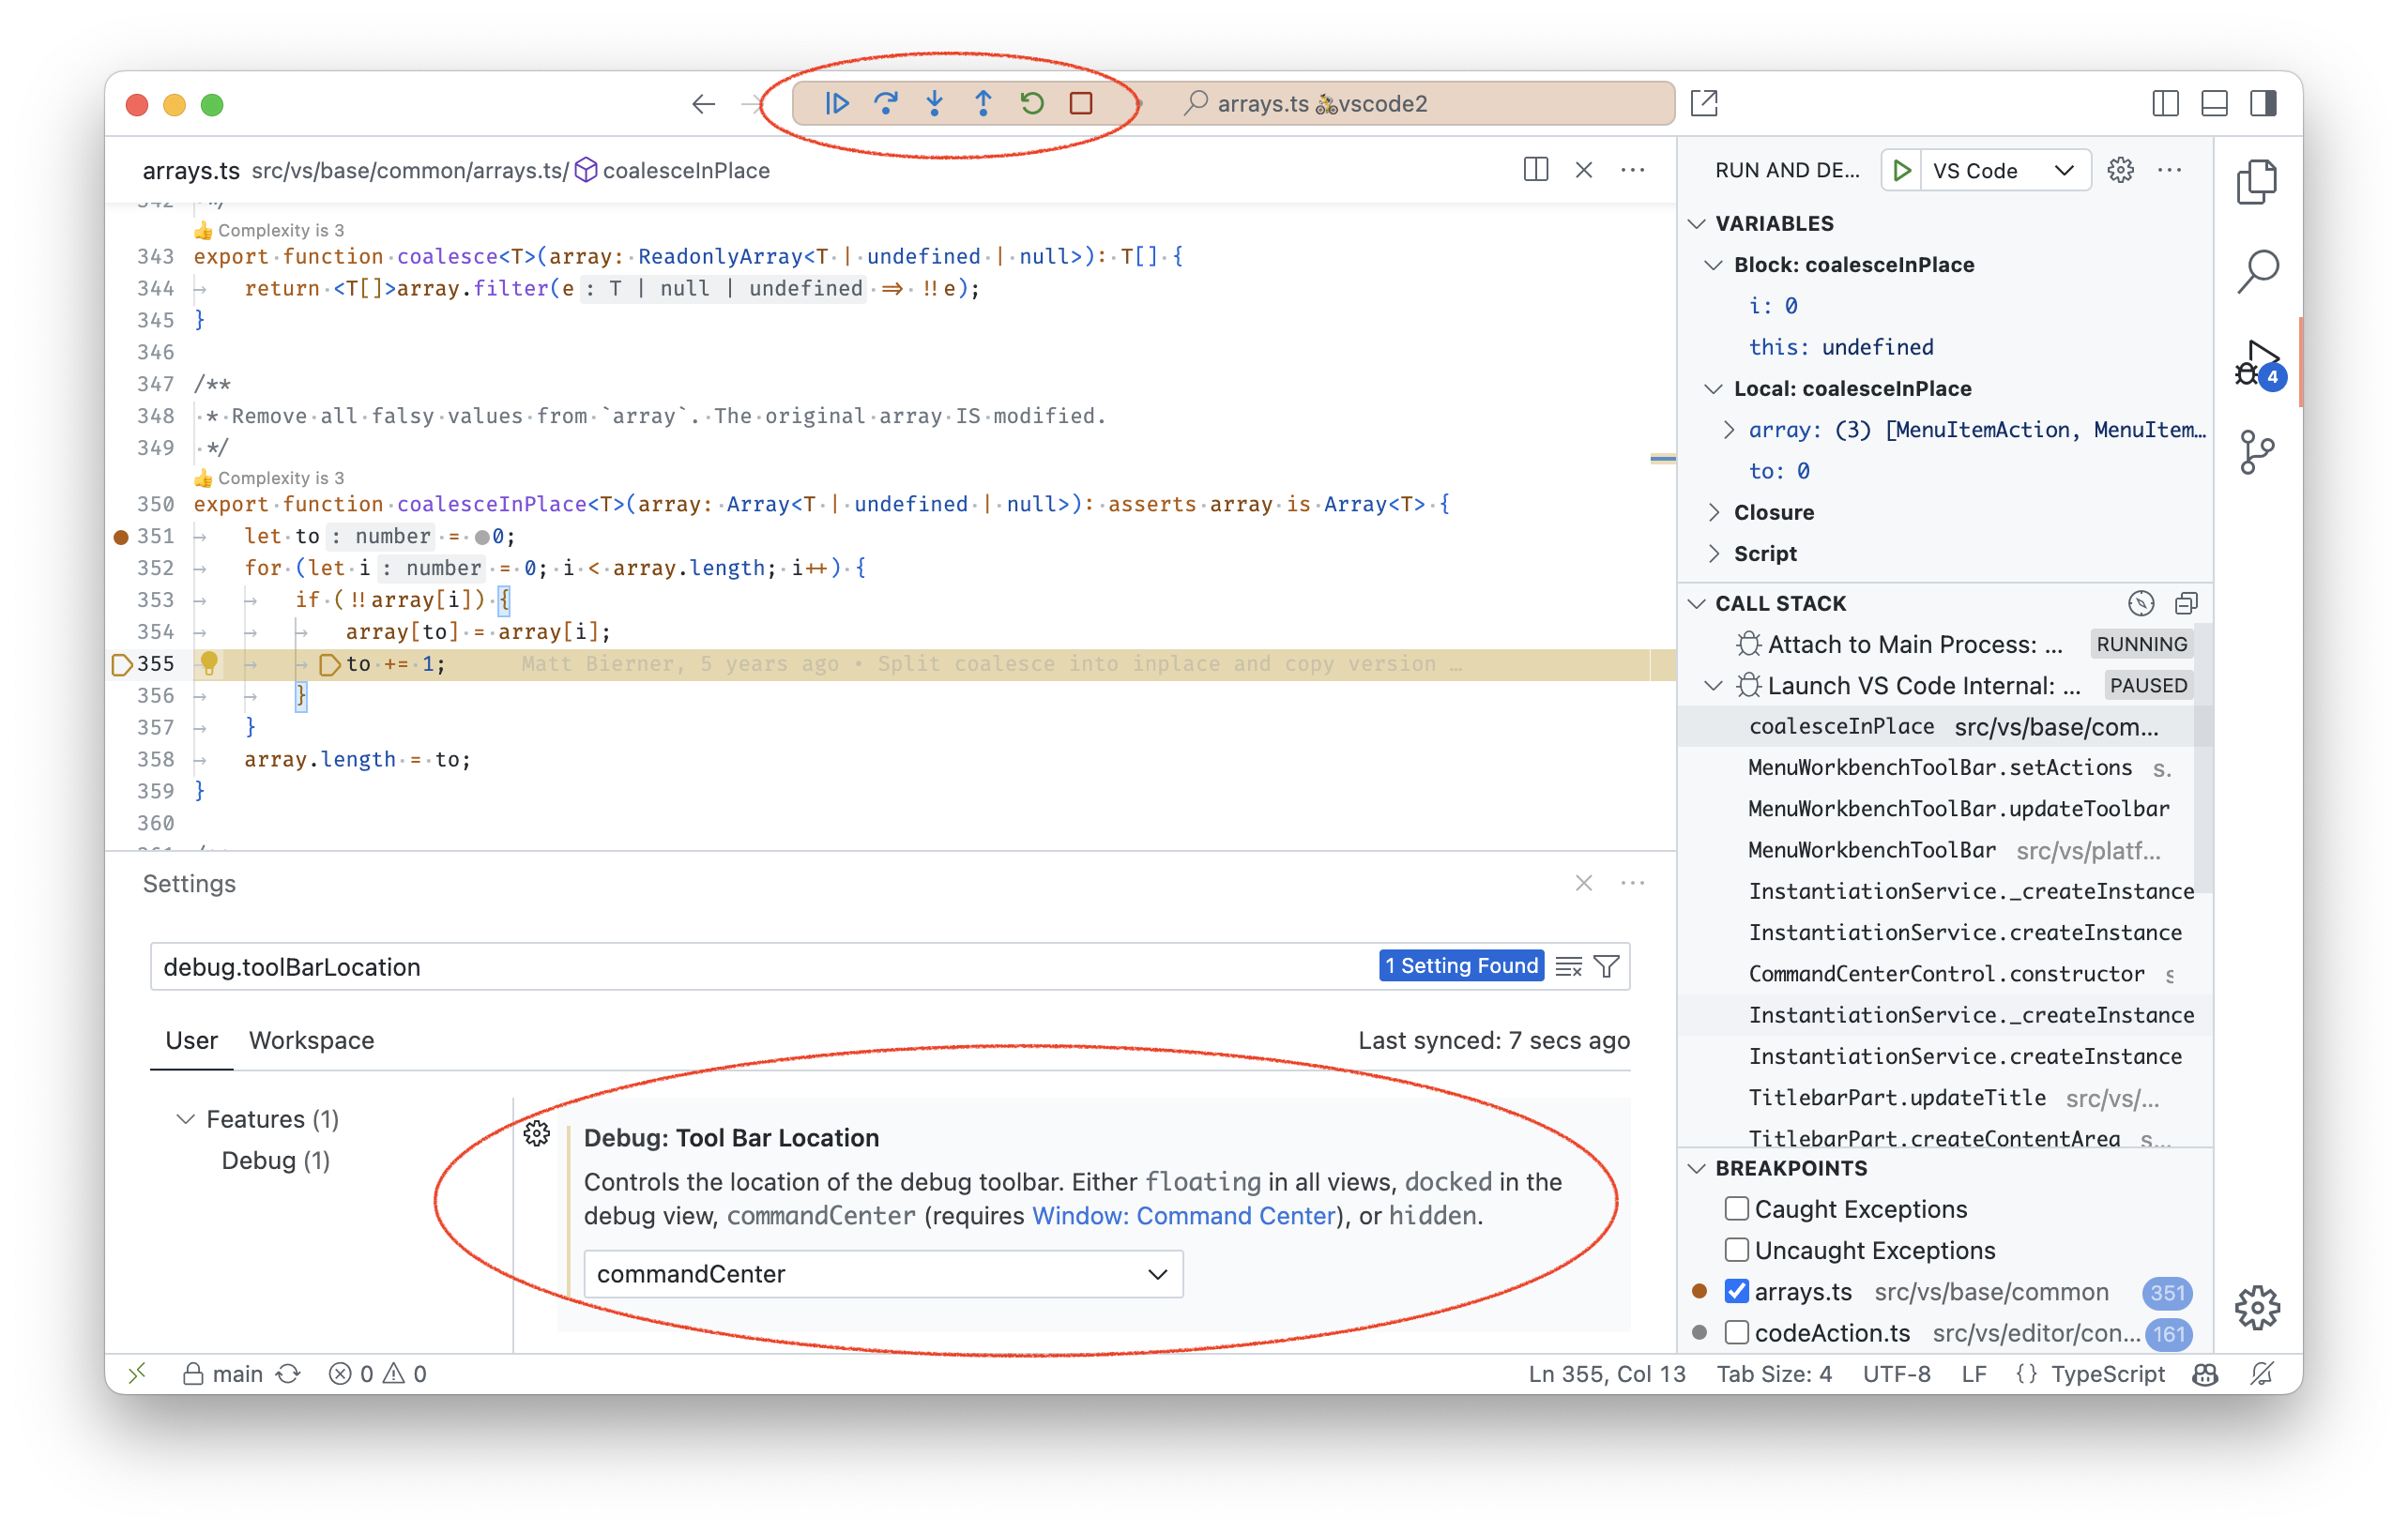
Command Center and Debug toolbar
There is a new experimental setting to show the Debug toolbar inside the Command Center. Make sure to have the Command Center enabled and configure the debug.debugToolbarLocation setting:
"debug.toolBarLocation": "commandCenter"
Theme: GitHub Light Colorblind (Beta) (preview on vscode.dev)
Extension Authoring
Support for Unicode character class escapes for string setting validation
Unicode character class escapes are now supported in regexes to validate string and string array settings. In other words, string and string array settings can now specify a pattern field with a value such as "\\p{Letter}+", allowing string values that only contain letters.
Support for Unicode character class escapes is not available for object settings with string values at this time.
Contribute to terminal menus
There are two new menus that can be contributed to terminal/context and terminal/title/context, which add entries to the terminal context menu and terminal tab context menu respectively. Example usage:
{
  "contributes": {
    "menus": {
      "terminal/context": [
        { "command": "terminalTest.sendText" }
      ],
      "terminal/title/context": [
        { "command": "terminalTest.sendText" }
      ]
    }
    }
}
New env.onDidChangeShell event
There is a new env.onDidChangeShell: Event<string> event that fires when the value of env.shell changes.
keytar removed from VS Code
Back in June, we moved the SecretStorage API over to using Electron's safeStorage and included a deprecation and removal plan of the now archived and unmaintained keytar module from VS Code. We didn't remove keytar initially because some extensions were still importing/requiring keytar directly (this was recommended before the SecretStorage API existed, but not after the SecretStorage API was released).
Based on product telemetry and Insiders builds without keytar, the usage of keytar has dropped and we are ready to remove keytar entirely from VS Code.
What does this mean for my extension?
If you use the SecretStorage API, nothing. We had been migrating secrets out of keytar since June so all of your secrets should be migrated over already if they were touched in the span of two months.
If you are still using keytar directly in your extension, there are a couple of options for you to consider:
- (recommended) Use the SecretStorage API that VS Code provides on the ExtensionContext. This API is cross-platform and works on all platforms that VS Code supports. It is also maintained by the VS Code team, will continue to be maintained, and has been a part of the VS Code API for years at this point.
- (not recommended) You can bundle the keytar module with your extension. Keep in mind that
keytaris a native node module, which means that you will need to publish a platform specific extension for each platform you want to support.
--disable-keytar is renamed to --use-inmemory-secretstorage
The --disable-keytar flag disabled persisting secrets on the machine when the SecretStorage API was used. This was primarily used in CI environments that often didn't have a keyring configured because without it, VS Code would throw an error when the SecretStorage API was used without a keyring available.
Since we've removed keytar, this flag needed a new name. We've now marked --disable-keytar as deprecated in favor of --use-inmemory-secretstorage. In the future, we will consider removing --disable-keytar, but it's not going away in the near future.
Lastly, we want to thank all the incredible extension authors that acted quickly to move off of keytar and ensure their users have a great and secure experience with secrets in VS Code!
Language Server Protocol
New versions of the Language Server Protocol npm packages have been released (protocol@3.17.5, client@9.0.1 and server@9.0.1).
Highlights of the release are:
-
Added proposed inline completion request.
-
Added proposed formatting ranges request.
-
Added proposed refresh request for folding ranges. This changed the shape of the folding range feature since the API needs to expose the event emitter and is a breaking change. To get to the provider, you now need to use the following code:
client.getFeature(lsclient.FoldingRangeRequest.method).getProvider(document)?.provider; -
Various bug fixes.
Engineering
Floating editor windows exploration
We have started to explore how to pull editors out of the workbench window into their own windows. This feature is our highest upvoted feature request and we plan to have a first working version for our Insiders users to play with in October.
All editors across all windows operate on the same underlying editor models, so that changes made in one window are reflected live in all other windows. You can create any editor layout in the floating windows and open any editor you like, in as many windows as you want.
For our first working version, we envision that the Status bar would also be present in the floating windows so that editor information - such as line numbers and selection ranges - is shown. Stay tuned for more development in the coming months!
vscode.dev is now cross origin isolated
Cross origin isolation is now enabled for vscode.dev. This enables new powerful features like shared array buffers, which are the building block for cross file TypeScript support, Python execution in the web, and vscode-wasm-wasi in general.
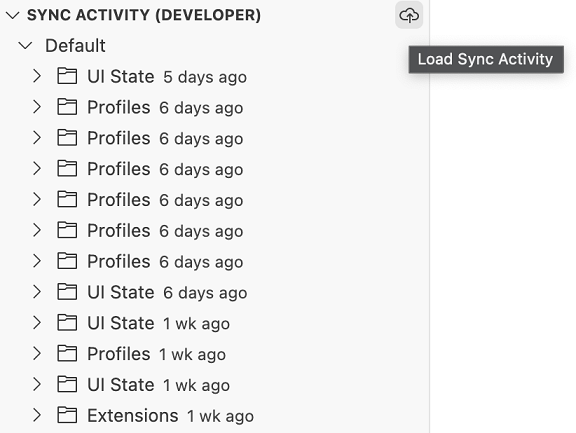
Settings Sync troubleshooting
We have added a new developer command Developer: Download Settings Sync Activity that downloads all your Settings Sync activity, both on cloud and on your local machine, including the logs. This will help us troubleshoot issues with Settings Sync. We have also created a new view to browse the downloaded activity. You can open the view by running the command Settings Sync: Show Synced Data and enabling SYNC ACTIVITY (DEVELOPER) view. You can load the downloaded sync activity by selecting the Load Sync Activity button in the view as shown below.
Notable fixes
- 190679 Theme color icon.foreground is inconsistent and does not work with
.svg
Thank you
Last but certainly not least, a big Thank You to the contributors of VS Code.
Issue tracking
Contributions to our issue tracking:
- @gjsjohnmurray (John Murray)
- @IllusionMH (Andrii Dieiev)
- @starball5 (starball)
- @ArturoDent (ArturoDent)
- @tamuratak (Takashi Tamura)
- @codespearhead (Code Spearhead)
Pull requests
Contributions to vscode:
- @antonioprudenzano (Antonio Prudenzano): added focus_in and focus_out events only on HTMLElement elements PR #181761
- @AVividLight (Michael Bethke): Fix Minimap AutoHide with StickyScroll Lines Running Together PR #188499
- @balaji-sivasakthi (Balaji Sivasakthi): Resolved conflicts between System High Contrast (HC) and VS Code High Contrast in ExtensionEditor PR #189773
- @bricker (Bryan Ricker): fixes typo in description for
terminal.integrated.environmentChangesRelaunchconfiguration PR #191841 - @ChaseKnowlden: Add banner for macOS 10.13 and 10.14 PR #192928
- @Connormiha (Mikhail): Simplify getting rangesToUpdate PR #192079
- @gabritto (Gabriela Araujo Britto)
- Add custom Node option to run TS Server PR #191019
- [typescript-language-features] Add option for excluding library symbols in "Go to Symbol in Workspace" PR #192798
- @gjsjohnmurray (John Murray)
- Tab separator setting referred to the same setting twice (fix #192497) PR #192577
- Improve messages on empty timeline (#_169205) PR #193369
- @hamirmahal (Hamir Mahal): feat: copy command and output in integrated terminal PR #192217
- @hsfzxjy (hsfzxjy): Faster __vsc_escape_value for bash PR #190899
- @jeanp413 (Jean Pierre)
- Fixes terminal group relative size not preserved PR #192519
- Fix terminal context menu not hiding after running action PR #193314
- @justanotheranonymoususer
- Remove superfluous arg in git smoke.test.ts PR #173194
- Clarify git api usage PR #174222
- @khubaibalam2000 (KhubaibAlam): Added hyperlink to Hot Exit for more details PR #193354
- @lukaszsamson (Łukasz Samson): Fix invalid match on
exitedDAP event PR #192117 - @NikoRaisanen (Niko Raisanen): fix: do not set this._sequence to undefined if path title not windows path PR #193232
- @qingpeng9802 (Qingpeng Li): improve
es5ClassCompatrobustness PR #163541 - @rebeccadee (Rebecca Dodd): Update info-needed label name in contributing doc PR #182528
- @sandersn (Nathan Shively-Sanders): Copilot-based TS refactors PR #192602
- @sbmelvin (Stephen Melvin): Fixed import paths not being updated when multiple files are moved PR #191403
- @troy351: add fallback for css var --vscode-sash-hover-size PR #187678
- @WardenGnaw (Andrew Wang)
- Add support for debugger type for selectAndStartDebugging PR #193156
- Add support to de-emphasize debuggers in run list PR #193157
- @weartist (Hans)
- Adjust openview PR #191907
- add fill selection text for quick search PR #191956
- @wickles: Detect more scoop git bash paths PR #192085
- @yiliang114 (易良): fix: Close #191880, Repair command cannot be searched by keyword after localization PR #191953
- @ykrx (Yulian Kraynyak): Add info marker to minimap PR #189282
Contributions to vscode-css-languageservice:
- @romainmenke (Romain Menke): add support for
::slotted,:host,:host-context,:nth-child(1n of .foo)and:nth-last-child(1n of .foo)PR #356
Contributions to vscode-html-languageservice:
- @johnsoncodehk (Johnson Chu): Implement
findDocumentSymbols2()PR #152
Contributions to vscode-languageserver-node:
- @AviVahl (Avi Vahl): fix: ensure bundlers pick up esm version PR #1326
Contributions to vscode-pull-request-github:
- @hsfzxjy (hsfzxjy): Add a refresh button in the header of comment thread PR #5229